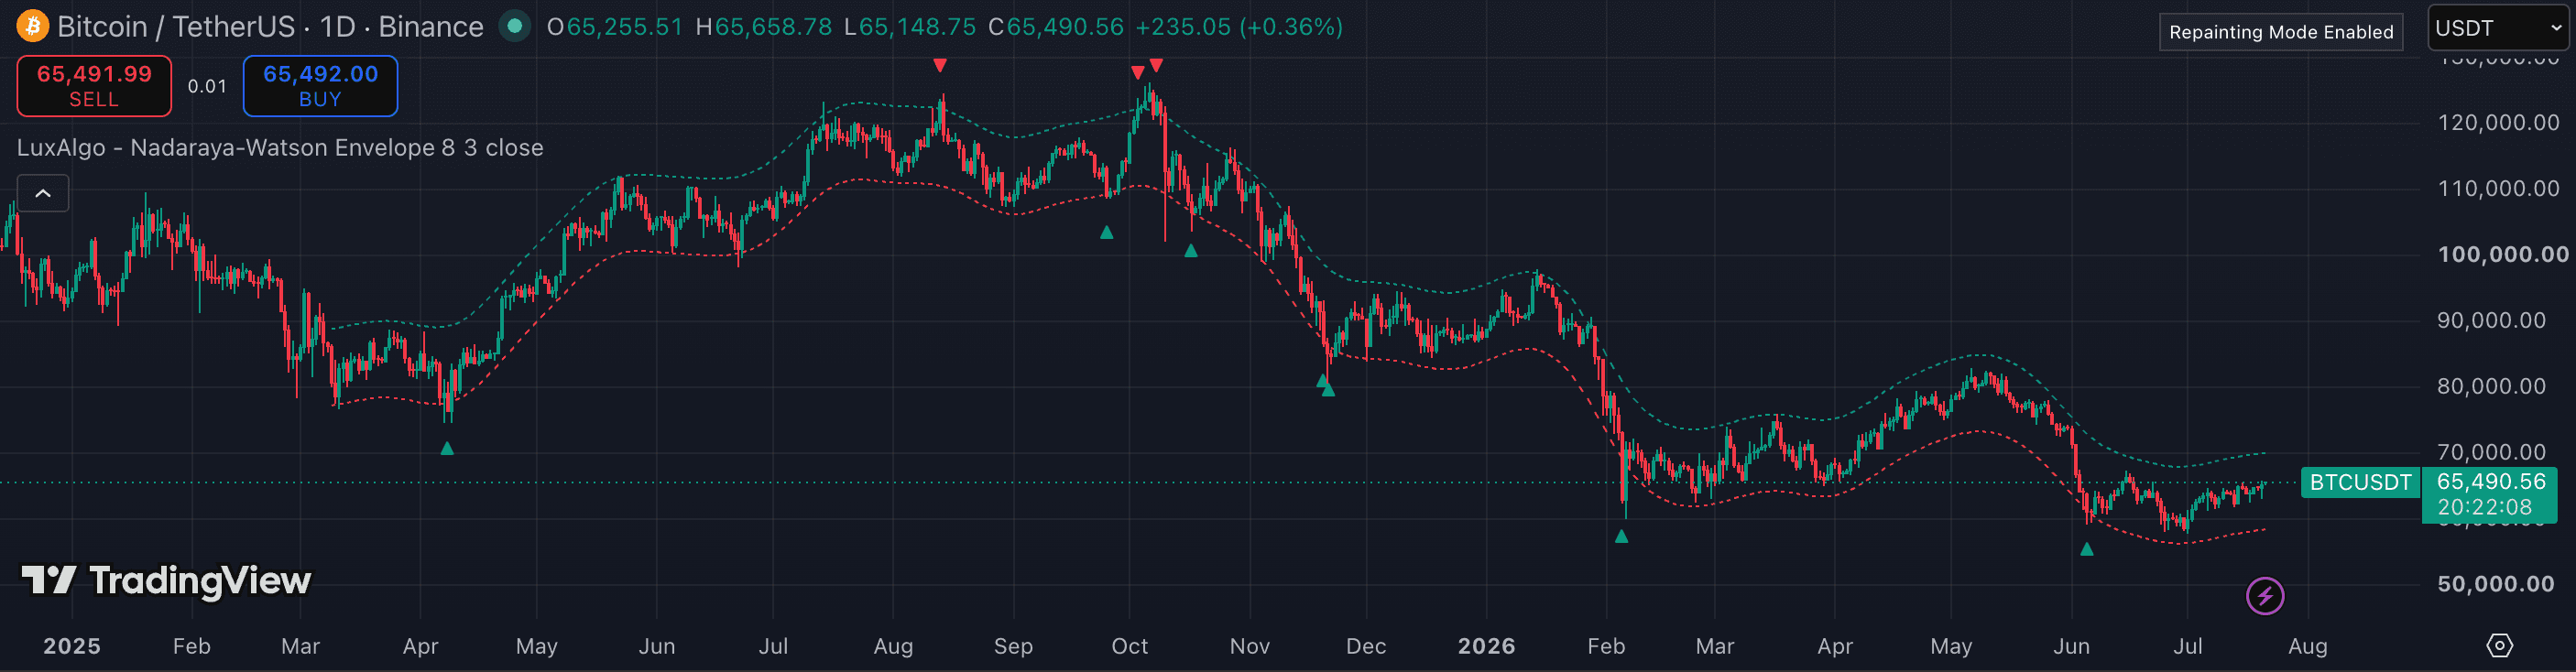
The Nadaraya-Watson Envelope draws a kernel regression curve through price — a non-parametric smoother that weights recent bars more heavily — and then places upper and lower bands at a fixed distance from that curve. When price touches the outer band and closes back inside, it is statistically stretched relative to where the model thinks price 'should' be. The envelope is popular on crypto 1h–4h charts for mean-reversion setups. The critical caveat: the curve is calculated over the entire visible range and repaints on the open bar. Every strategy built on this indicator must use confirmed, closed bars only. The free implementation by LuxAlgo ('Nadaraya-Watson Envelope [LuxAlgo]') is the most widely used version on TradingView.
1. Add the indicator and understand what you are looking at
Search for 'Nadaraya-Watson Envelope [LuxAlgo]' in the TradingView indicator library. The indicator draws a smooth curve through price and two outer bands — upper and lower — at a distance controlled by the 'Multiplier' setting.
The curve is not a moving average. It is a kernel regression estimate that recalculates over the entire visible chart range. This means the historical curve shifts slightly as new bars appear. Only the current (open) bar repaints. Closed bars are fixed.
The trading premise: price that has moved to the outer band is statistically stretched and more likely to revert toward the center curve. The center curve is the mean-reversion target, not a re-entry signal.
2. Set the bandwidth (h) for your timeframe and pair
The bandwidth parameter (h) is the most important setting. A higher h produces a smoother, slower-moving curve; a lower h makes the curve hug price closely and flag more touches — most of them noise.
For crypto on 1h: start with h = 8. On 4h: h = 8–10. On 1D: h = 10–12. These are starting points; volatile altcoins may need h pushed higher (10–14 on 1h) to filter out thin-liquidity spikes.
Do not lower h until every minor wiggle looks like a band touch. The envelope should flag extended moves, not routine price oscillation.
3. Set the multiplier to define the band width
The Multiplier setting controls how far the bands sit from the regression curve, measured in ATR or a similar unit depending on the version. At the default (3.0), the bands should contain the vast majority of price action.
If price is constantly at or beyond the outer band, increase the multiplier. If bands are almost never touched, decrease it slightly. The goal is that outer-band touches are meaningful events — perhaps 5–10% of all bars on your chosen timeframe.
For high-volatility crypto pairs (altcoins, smaller caps), a multiplier of 3.0–3.5 is typical. For BTC and ETH on 4h, 2.5–3.0 is a reasonable range.
4. Trade band touches on closed bars only
Never act on a band touch while the bar is still open. The regression curve repaints on the current bar, so any signal generated mid-bar can vanish when the bar closes.
A valid signal: price has closed at or beyond the outer band, the bar has confirmed closed, and price has started closing back inside the band on the next bar.
Add a momentum filter to avoid fading strong trends. RSI above 65 on the same timeframe while price is at the upper band is a warning that the trend may continue rather than revert. Wait for RSI to roll over before entering a short reversion trade.
5. Define your mean-reversion target and stop
The center regression curve is your primary mean-reversion target. Size trades so that reaching the center curve gives at least a 1.5:1 reward-to-risk ratio against your stop.
Place stops beyond the outer band — 0.3–0.5% past the band extreme on 4h, or slightly wider for volatile altcoins. If price continues beyond that level after the bar closed inside the band, the setup has failed.
Do not hold for a full band-to-band reversal as a default target. Price often stalls at the center curve, especially in markets with directional bias. Take partial profit at the center and trail the rest if momentum continues.
- Acting on band touches while the bar is still open — the envelope repaints on the current bar and the touch can disappear by close.
- Setting bandwidth too low, causing the curve to hug price and every candle to appear as a signal.
- Fading a strong trend with no momentum filter — the envelope will show outer-band tags throughout an extended trend run, but reversion entries in a trending market are dangerous.
- Setting the mean-reversion target as the opposite outer band instead of the center curve — most reversion moves stall at the center.
- Using the indicator on illiquid pairs or very low timeframes (under 5m) where kernel regression becomes dominated by single-candle spikes.