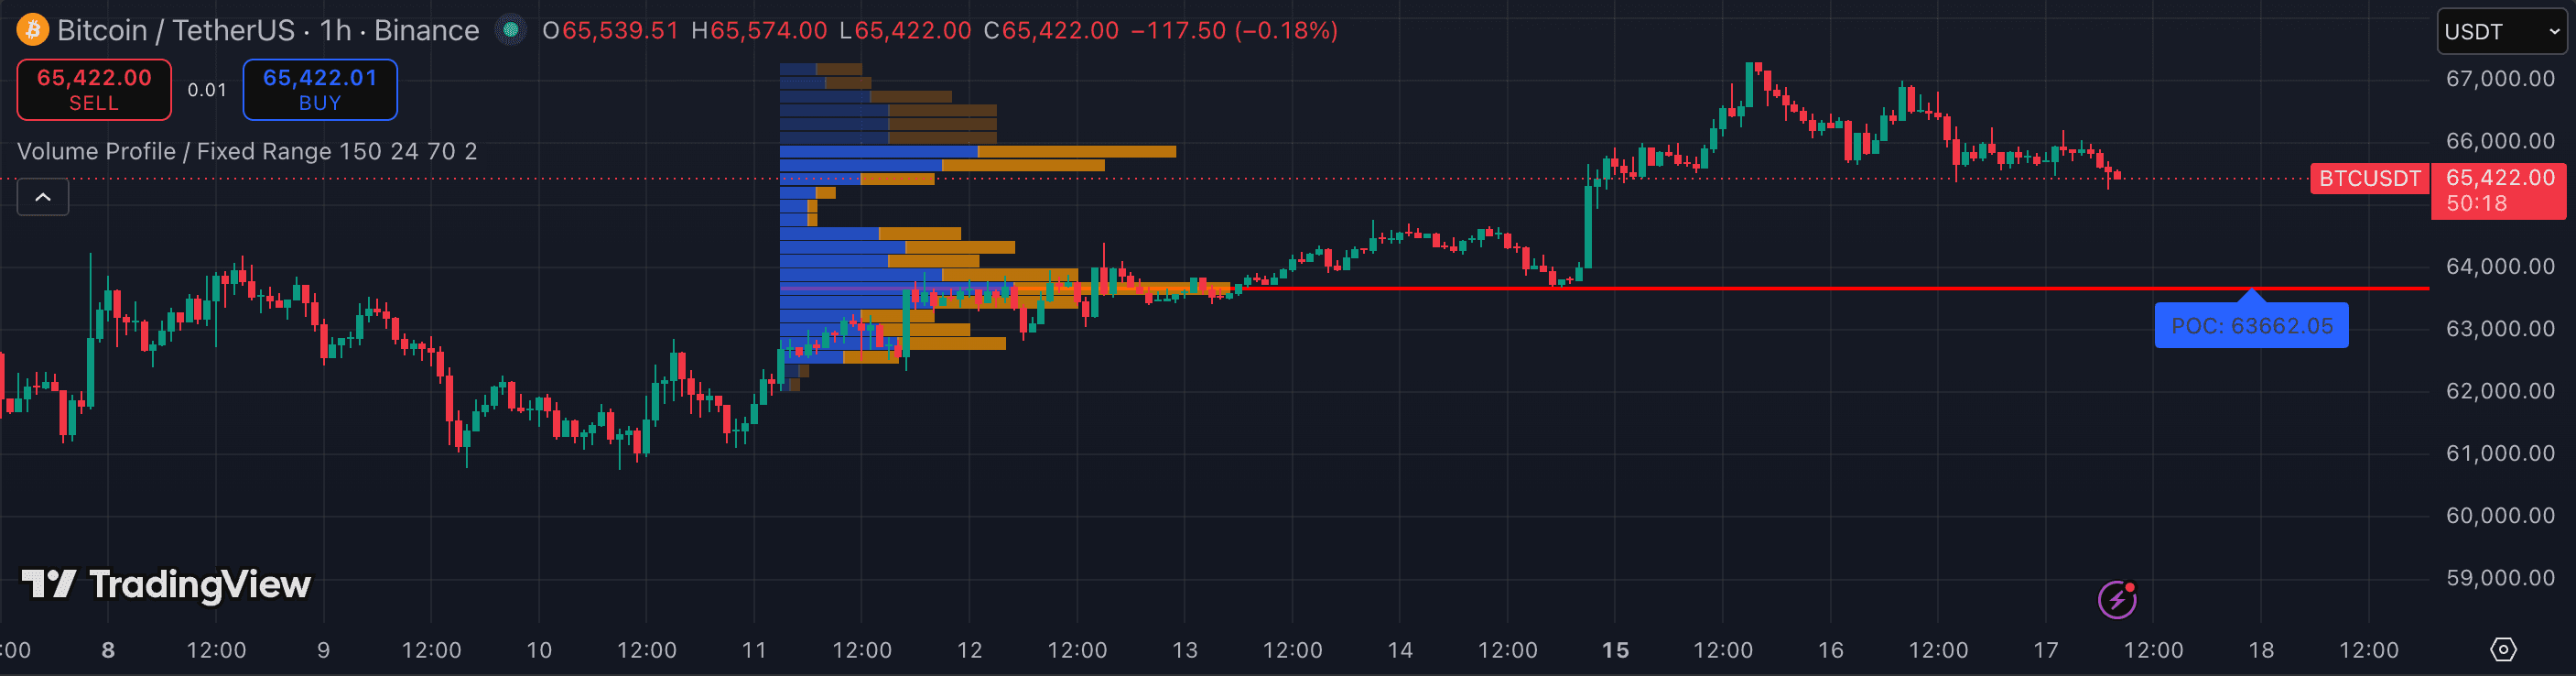
Volume Profile plots how much volume traded at each price level — not over time, but at specific prices. The result is a horizontal histogram that reveals where the market found the most agreement (high-volume nodes) and where it rushed through with little participation (low-volume nodes). That information explains level behavior that plain S/R lines and moving averages can't: why price stalls at one price and slices through another. Here's how to read and use it on crypto.
1. Understand what the histogram shows
The Volume Profile histogram has two key structures: High-Volume Nodes (HVN) are price levels where heavy trading occurred — these are acceptance zones where the market found value, and they tend to act as magnets and strong support or resistance. Low-Volume Nodes (LVN) are thin gaps in the histogram where little trading took place — price tends to move through these quickly, either as a launch zone or as a fast rejection.
The Point of Control (POC) is the single most-traded price level over the selected range — the horizontal bar that extends furthest on the histogram. It represents the 'fairest' price in the selected window and is often the strongest single level on the chart.
2. Anchor the Fixed Range profile to meaningful swings
TradingView's Volume Profile Fixed Range lets you drag the profile over any price range you choose. That selection determines everything — a poorly chosen range produces meaningless levels. The right anchor points are: a complete swing (from a major high to the subsequent low, or the reverse), a consolidation range, or a significant structural period such as a month of accumulation.
For day trading BTC or ETH, a common setup is one profile anchored to the current week and a second anchored to the current month — two different time windows that surface intraday and swing levels simultaneously.
3. Trade the POC as a high-participation level
The POC is the level where the most contracts changed hands — it represents a genuine price agreement zone. In a trending market, price often returns to the POC on pullbacks before continuing. In a ranging market, the POC acts as a magnet that price gravitates toward from both directions.
The cleanest trade off the POC is a rejection: price returns to the POC, shows a clear rejection candle (a wick, a pin bar, or a bullish/bearish engulfing bar), then moves away. Enter on the confirmation candle with a stop just behind the POC zone.
4. Use LVNs as breakout confirmation zones
When price is trending and breaks through an LVN, the move tends to be fast — the thin participation at that level means there's little stopping the advance. This makes LVNs useful as breakout confirmation: once price closes through an LVN, the next HVN is typically the target.
Conversely, an LVN acting as a resistance level is fragile. If price approaches an LVN from below and hesitates, the more likely outcome is a breakout through it rather than a sustained reversal — there's simply not enough volume history there to hold it.
5. Combine with a momentum read for entry timing
Volume Profile identifies where to trade; momentum indicators tell you when. A POC or HVN level lines up with a VWAP reclaim, an RSI divergence, or a MACD histogram flip — that stack gives you both location and trigger, which is the minimum for a structured entry.
Volume Profile by itself gives you levels, not timing. Waiting for a price action signal at the level before entering eliminates many of the 'technical but wrong' level trades that happen when price slices straight through a node without pausing.
- Treating every HVN as an automatic reversal level — in a trend, price often pushes through a high-volume node on the first attempt. Wait for a rejection signal before entering.
- Anchoring the profile to a random candle range rather than a complete, meaningful swing — the levels only carry weight if the anchor window reflects a real market structure.
- Using the Visible Range profile instead of Fixed Range — the Visible Range shifts as you scroll the chart, which changes the levels and makes them inconsistent.
- Ignoring LVNs and focusing only on HVNs — the gap between nodes is as important as the nodes themselves for understanding how quickly price will move through a zone.
- Using Volume Profile as a standalone entry trigger without a momentum or candle confirmation at the level.