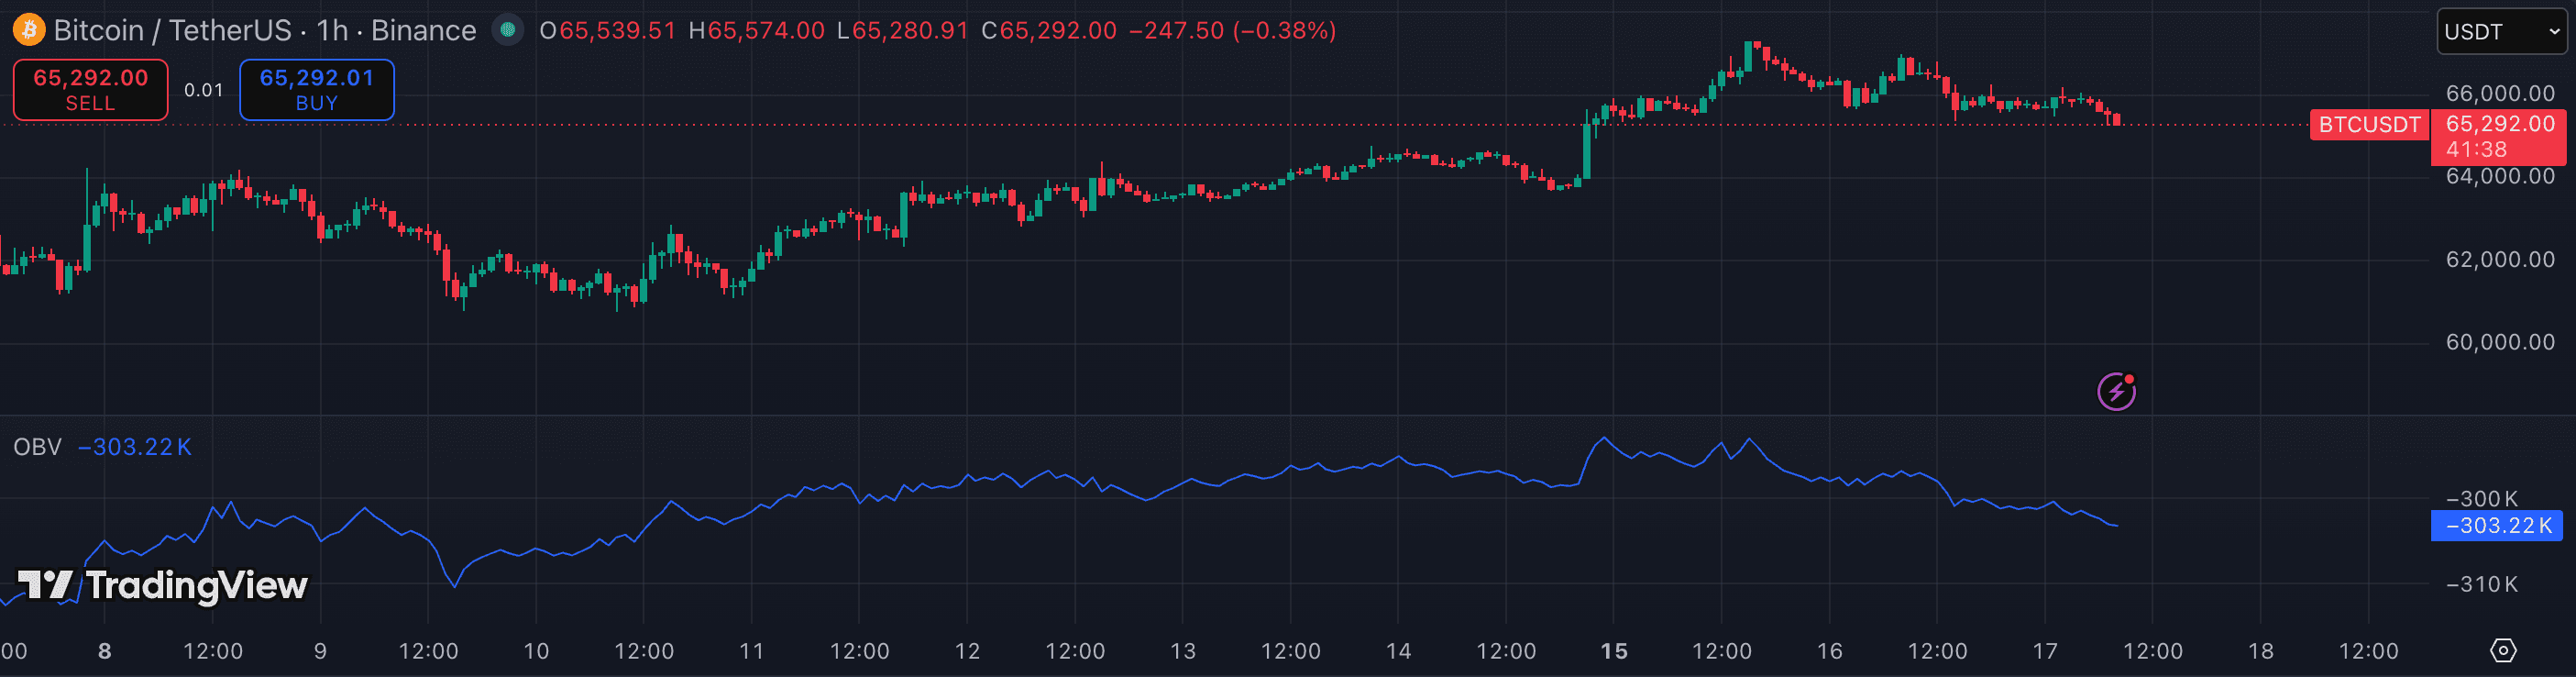
On-Balance Volume is almost parameter-free, which makes it both easy to set up and easy to misread. The real skill with OBV is knowing what to look at — and what to ignore. This guide covers the one meaningful setting and then the three patterns that generate actual edge.
1. Set up OBV — the one parameter worth adjusting
TradingView's built-in OBV has no length setting — it's always cumulative from the chart's first visible bar. What you can add is a moving average on top of OBV as a smoothing signal line. Many traders add a 20-period EMA of OBV to see its trend direction more cleanly.
To add the signal line: right-click the OBV indicator → Add indicator on OBV → Moving Average. Set it to EMA, length 20. Now you can read OBV's direction by whether it's above or below its own EMA.
2. Ignore the absolute level — focus on trend and direction
OBV's absolute number is meaningless — it depends entirely on the starting bar of your chart. A number like '+2,400,000' tells you nothing. What matters: is OBV rising, falling, or flat? Is it making higher highs alongside price, or lagging behind?
The primary read: if price and OBV are both making higher highs, the breakout has real volume participation. If price makes a new high but OBV doesn't, buying interest is not backing the move.
3. Use divergence as a confirmation filter — not a trigger
Bullish divergence: price makes a lower low, OBV makes a higher low — selling pressure is being absorbed. Bearish divergence: price makes a higher high, OBV makes a lower high — buyers are drying up.
Divergence is a warning, not a reversal signal. Wait for a structure break or candle pattern before acting. OBV divergence on BTC/ETH 4h and above is more reliable than on lower timeframes or low-volume alts.
4. Match OBV timeframe to your trade style
For swing trading: run OBV on the 4h or daily chart. Read the trend direction of OBV over the past 5–10 bars. A consistently rising OBV in an uptrend confirms accumulation; flat or falling OBV in an uptrend warns the move lacks conviction.
For day trading: OBV on the 15m or 1h is useful for breakout confirmation — if price breaks a key level and OBV surges, the break is volume-backed. If OBV is flat or dropping, the breakout may fail.
- Treating the OBV absolute number as meaningful — it isn't; only the direction and relative swings matter.
- Acting on OBV divergence without waiting for price confirmation — divergence can persist through several more bars before resolving.
- Using OBV on low-volume crypto pairs where thin order books make volume data unreliable.
- Stacking OBV with CVD and treating them as independent signals — both are volume-flow reads and will generally agree. One is enough.