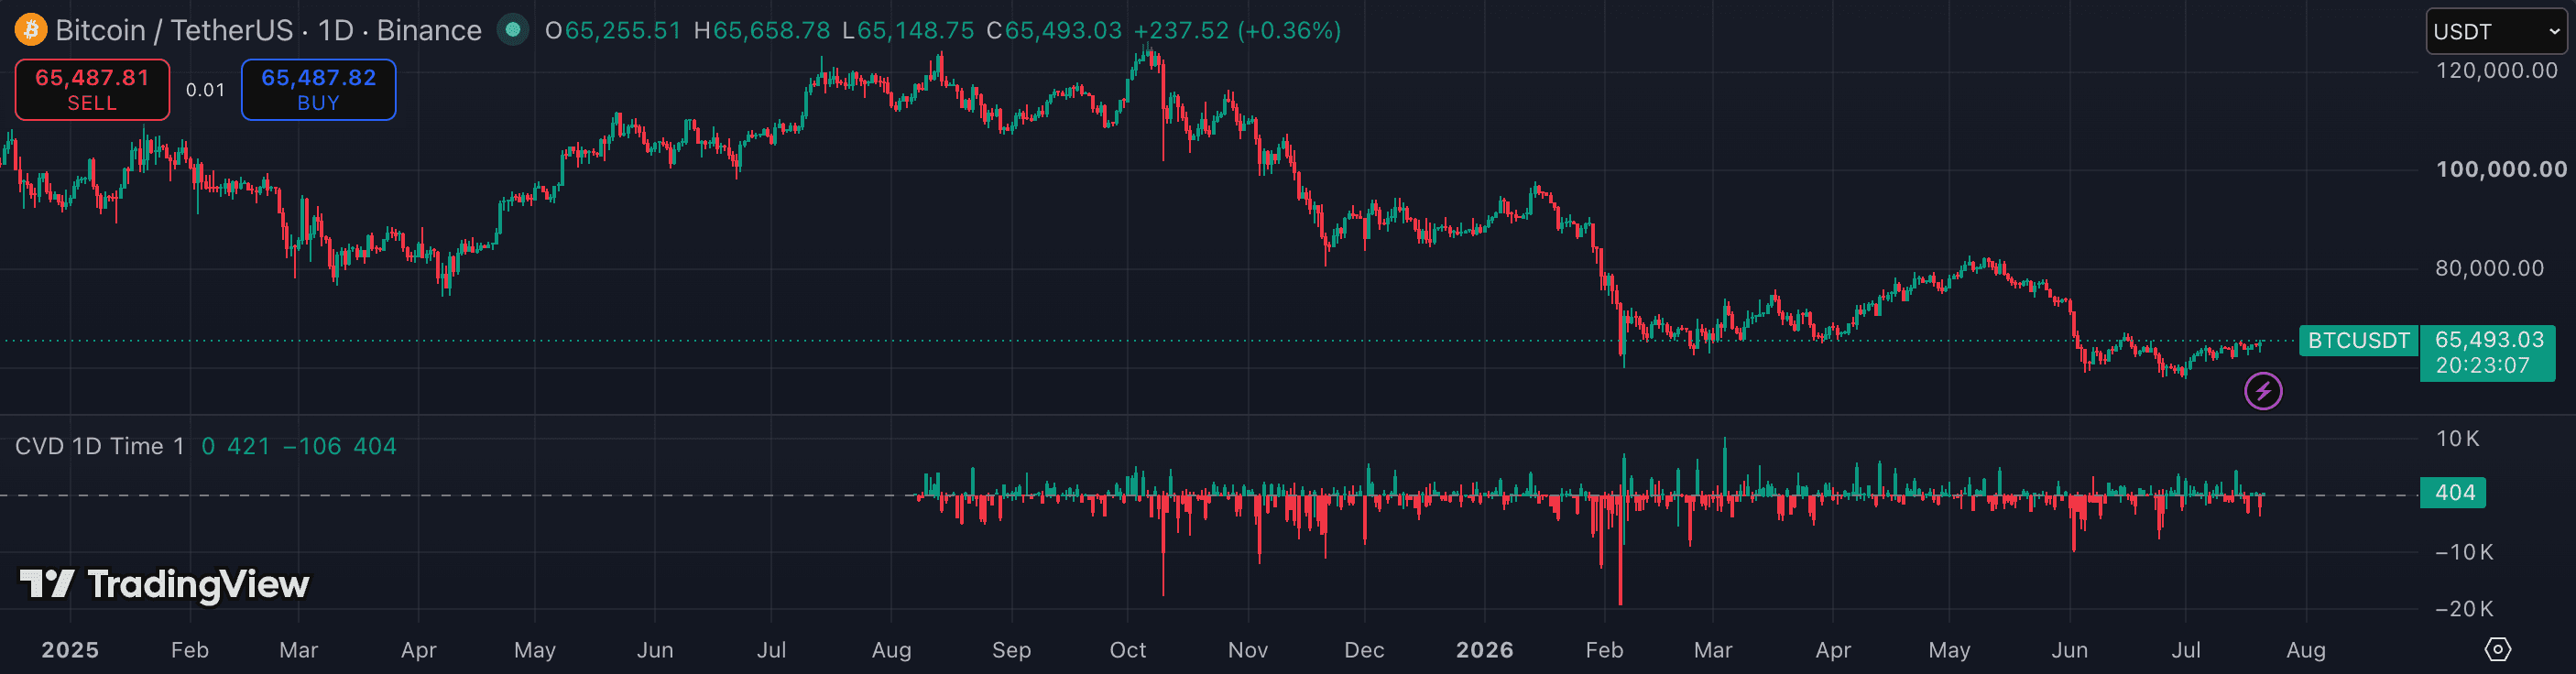
CVD (Cumulative Volume Delta) adds up the net difference between aggressive buy volume and aggressive sell volume bar by bar into a running line. A price candle tells you where price went; CVD tells you who drove it there. When a rally has rising CVD, real buyers are behind it. When price rises but CVD is flat or falling, sellers are absorbing the move — and that divergence is the earliest warning the advance may not hold. This guide shows how to read and apply CVD on liquid crypto pairs.
1. Understand what CVD actually measures
CVD separates volume into two buckets: aggressive buy volume (market orders that lifted the ask, i.e. buyers paying up) and aggressive sell volume (market orders that hit the bid, i.e. sellers taking the price down). The delta is the difference between the two; CVD is the running sum of that delta over your chart's history.
The practical meaning: a rising CVD means buyers have been more aggressive than sellers cumulatively. A falling CVD means sellers have dominated. The slope matters far more than the absolute level — the level depends on where the calculation started and changes with each chart load.
2. Read CVD divergence from price
The most powerful CVD signal is divergence. Bearish divergence: price makes a new high while CVD fails to — aggressive buyers are not participating in the price push. The rally is being 'absorbed' by sellers or driven by passive orders, not real demand. That is a warning to tighten stops or look for confirmation before adding.
Bullish divergence: price makes a new low but CVD makes a higher low — sellers are hitting the market but the cumulative pressure is easing. That absorption of sell-side flow often precedes a bounce or reversal. Require this to show on 15m or higher before acting; 1m CVD spikes from single large orders create misleading noise.
3. Confirm breakouts with CVD
A price breakout above resistance accompanied by a simultaneous CVD breakout — CVD also making a new high — is a demand-driven move with aggressive buyers behind it. That is a higher-quality continuation signal than a price breakout on flat or declining CVD.
Conversely, a price breakout with CVD not confirming (or even declining as price rises) is a candidate for a fakeout. It does not guarantee reversal, but it warrants a smaller initial position and a closer stop until CVD confirms.
4. Use it intraday on liquid pairs
CVD works best on BTC, ETH, and SOL — assets with deep order books and reliable volume reporting. On low-cap altcoins, thin order books mean a single large order distorts the delta dramatically without representing genuine institutional flow.
For intraday day trading, combine a 5m or 15m CVD with your price chart. The session-level read: is CVD trending upward (buyers in control) or downward (sellers in control)? That gives you a session bias independent of price direction alone.
5. Pair with a structural price level for entries
CVD tells you the order-flow context; it does not tell you where price will stop. Combine it with a VWAP level, a Volume Profile POC, or a key support/resistance zone. The workflow: identify the price level → check whether CVD divergence confirms what you expect at that level → take the trade only when both align.
A price pullback to VWAP with CVD showing bullish divergence (price lower, CVD higher) is a more structured long entry than either signal alone. CVD adds the order-flow confirmation that explains why the level should hold.
- Using CVD on low-cap altcoins — thin order books distort the delta; the signal only carries weight on liquid pairs with reliable volume.
- Acting on CVD divergence without a price-level confirmation — divergence tells you something may be off; a structural level tells you where price is likely to react.
- Comparing absolute CVD levels across different sessions or chart loads — the value resets differently each time; only slope and divergence carry information.
- Treating CVD as a standalone entry trigger — it is a confirmation and warning tool, not a direction signal by itself.
- Using 1m CVD as a primary read — single large market orders spike the delta and produce misleading divergences at very low timeframes.