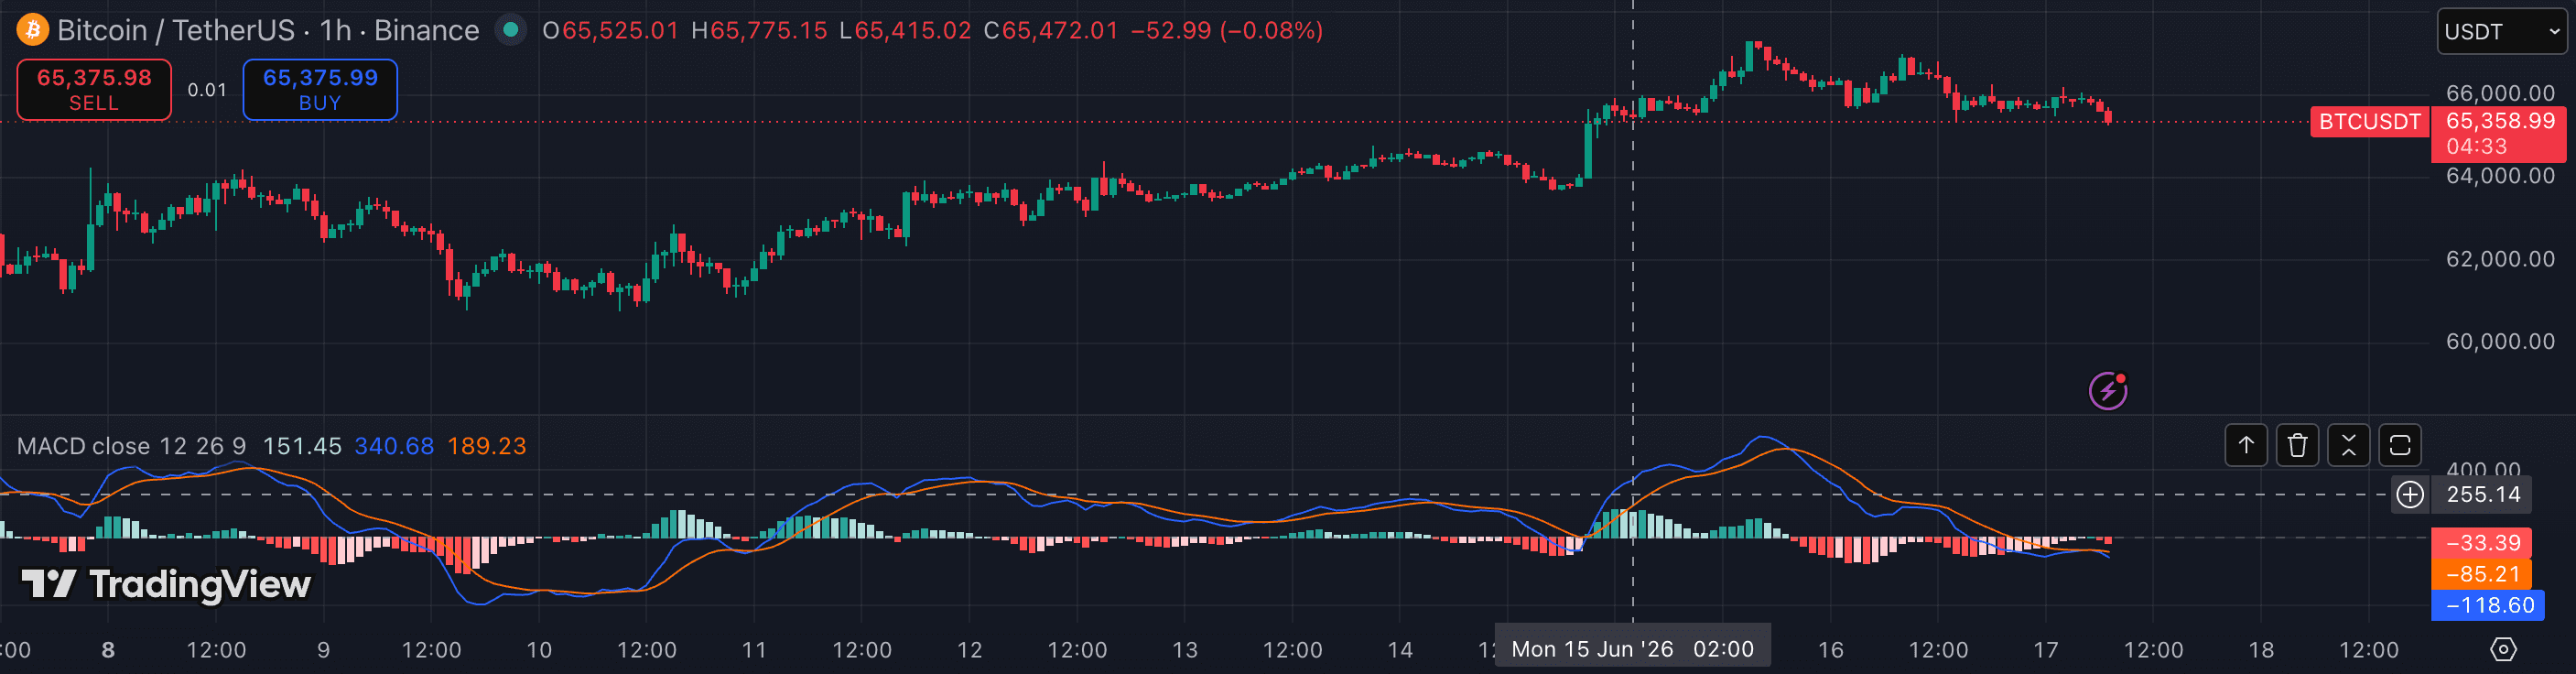
MACD (Moving Average Convergence Divergence) subtracts a 26-period EMA from a 12-period EMA to create a signal that tracks both trend and momentum. It's the most-searched indicator on TradingView, which makes it worth understanding well — because most traders focus on the line cross and ignore the two signals that carry more weight: the histogram and the zero line. This guide shows you how to read all three layers.
1. Understand the three components
The MACD line (fast EMA minus slow EMA) moves above and below zero. The signal line (9-period EMA of the MACD line) is smoother and slower. The histogram shows the gap between them — it's the early-warning layer.
Most traders wait for the MACD and signal lines to cross. That's the last thing to happen. The histogram shrinks before the lines cross, giving you a head start on momentum shifts.
2. Use the zero line for trend bias
When the MACD line is above zero, the 12-period EMA is above the 26-period EMA — short-term momentum is outpacing the longer average. That's the bullish regime. Below zero is bearish.
This single read — is MACD above or below zero? — gives you a trend filter you can apply to every trade. Only take long setups when MACD is above zero, shorts when below. It won't be perfect, but it cuts many of the worst counter-trend losses.
3. Read the histogram as momentum velocity
The histogram grows when momentum is accelerating and shrinks when it's fading — before the price candles tell you anything. A histogram that has been making lower highs while price makes higher highs is bearish divergence; the reverse is bullish divergence.
In practice: when the histogram stops making new lows and starts flattening in negative territory, that's your first warning that the move is losing steam. The line cross comes later.
4. Avoid MACD in ranging markets
MACD is a trend tool built from EMAs, which means it lags and generates frequent false crosses when price is stuck in a horizontal range. If the ATR is low and price is chopping between two levels, MACD will give you crosses in both directions every few bars.
A simple filter: only trade MACD signals on 1h and above, and only when the histogram has been trending in one direction for at least three bars before the cross. That eliminates most of the whipsaw.
5. Pair with a structural level for entry
A MACD cross or histogram flip tells you momentum is shifting, not where to enter. Use a VWAP level, a key support/resistance, or a market structure point (BOS/CHoCH) as the actual entry trigger. MACD confirms the direction; the level gives you the location.
- Trading every line cross — in sideways markets MACD crosses constantly with no follow-through.
- Ignoring the histogram and waiting for the visual line cross, which arrives late.
- Using MACD as the sole entry signal with no structural confirmation or level.
- Running MACD on 1m charts where EMA smoothing wipes out any edge.
- Misreading the zero-line: a cross below zero in a downtrend is not a buy signal.