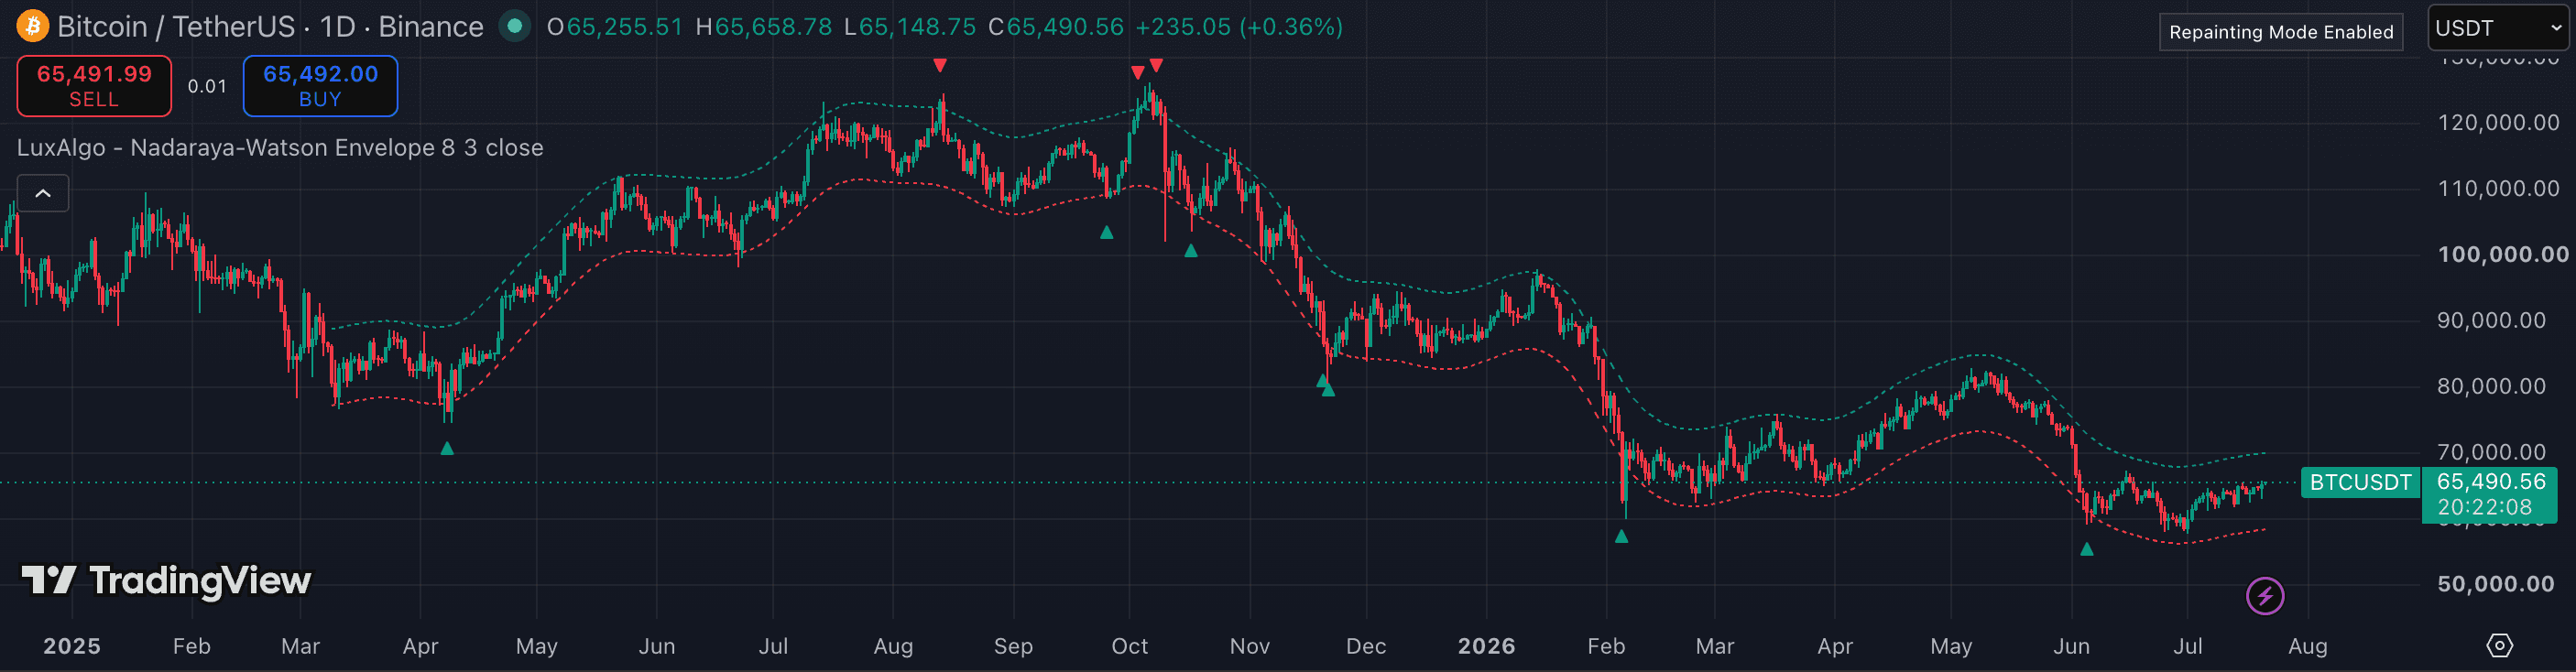
The Nadaraya-Watson Envelope uses a kernel regression smoother to draw a non-parametric curve through price and adds upper and lower bands at a configurable distance. Unlike a moving average that applies a fixed lookback window, kernel regression weights nearby bars more heavily and fits the curve to the actual shape of price action. The trading read: when price reaches the outer band and crosses back inside on a confirmed candle close, the overextension is signaling a potential mean-reversion move. This guide shows how to read it correctly — including its mathematically inherent repaint behavior on the current bar.
1. Understand the curve and the bands
The center curve is the kernel regression estimate — it fits to the visible price range and can look almost perfectly smooth. The bands are set above and below it by a fixed number of ATR units or a set multiplier. When price moves far outside the band, it is statistically extended relative to the curve's estimate of 'fair' price.
The key property: the curve uses data from the full visible chart window to fit itself, which means earlier bars are re-fitted as new bars arrive. On TradingView this causes the current (forming) bar to repaint — the curve adjusts as the bar closes. Only act on completed candle closes, never on an intrabar position of the curve.
2. Trade the band-crossing signal
The primary signal is a price close that crosses back inside the band from outside it. For a long setup: price closed below the lower band on the prior bar and closes back above it on the current bar. That is the crossing event — price was extended to the downside and momentum has flipped enough to recover inside the envelope.
For a short setup, the mirror: price closes from above the upper band back inside it. The cross must happen on a confirmed closed bar — not just a wick or an intrabar touch.
3. Apply a trend filter to avoid fading strong moves
The Nadaraya-Watson Envelope is a mean-reversion tool. In a strong, sustained trend, price can walk along the outer band for many candles and each crossing signal fires into a continuation move. Trading every cross in a trending market leads to repeated losses against the direction.
A simple filter: only take a crossing signal when the higher-timeframe trend (4h Supertrend, 1D MACD zero line, or the slope of the kernel curve itself) is neutral or opposed to the candle's direction. If the 4h is strongly bullish and price has been walking the upper band, skip the crossing short and wait for the trend to lose steam.
4. Tune the bandwidth (h) for your market and timeframe
The bandwidth parameter controls how closely the curve follows price. A lower bandwidth (e.g. 4–6) produces a curve that tracks price tightly with more whip; a higher bandwidth (e.g. 10–15) produces a smoother, slower curve. For crypto on 1h–4h, a bandwidth of 8 is a common starting point.
If the curve is so smooth that it rarely changes slope, the bands will consistently lag the market and produce signals well after the overextension has already resolved. If it tracks price too closely, the bands barely open and almost every bar crosses in and out. Find the bandwidth where a crossing signal represents a genuine stretch, not a normal price oscillation.
5. Pair with volume or momentum confirmation
A crossing signal with declining volume suggests the move driving price outside the band is losing participation — a higher-quality reversion setup. A crossing signal on very high volume in the direction of the overextension suggests the market is breaking out, not reverting — treat that as a signal to avoid the trade.
Adding a momentum read (RSI or OBV) provides an independent view of whether the move is exhausting. A band crossing paired with RSI divergence is a higher-quality setup than the crossing alone.
- Acting on intrabar curve positions — the kernel regression repaints on the current bar by design; only closed candle positions are stable.
- Fading every upper-band touch in a trending market — in a strong uptrend the envelope's upper band is where price spends most of its time.
- Using a bandwidth so high that the curve is nearly flat — the bands stop reflecting current price reality and signals arrive well after the overextension resolves.
- Taking crossing signals without a trend filter — the tool is designed for mean reversion, not trend-following; applying it blindly in strong trends produces repeated losses.
- Confusing this with a moving average — the kernel curve fits to the visible chart window and changes its historical shape as new bars arrive; a standard MA does not.