ADXvsHeikin Ashi
ADX and Heikin Ashi both help evaluate trends, but they present different evidence. ADX measures the strength of directional movement in a separate pane, while Heikin Ashi replaces regular candles with an averaged series that makes trend persistence easier to see. This comparison separates a regime-strength filter from a noise-reduced chart view. Educational content only; not financial advice.
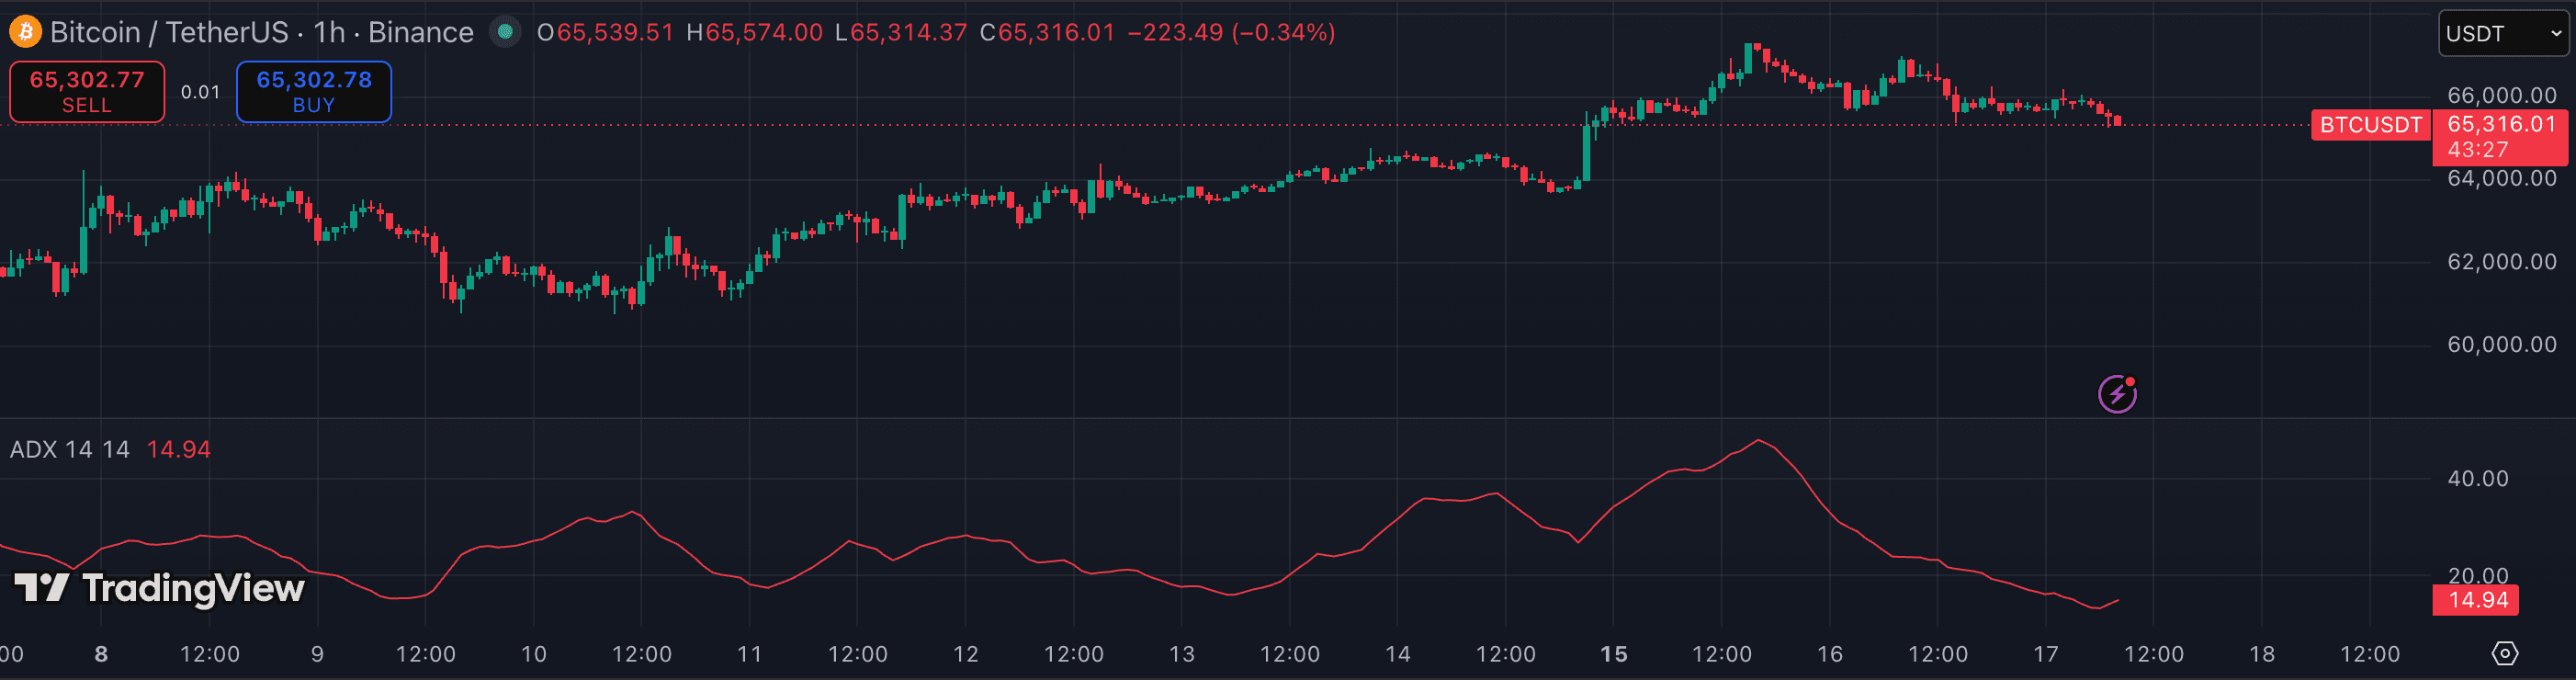
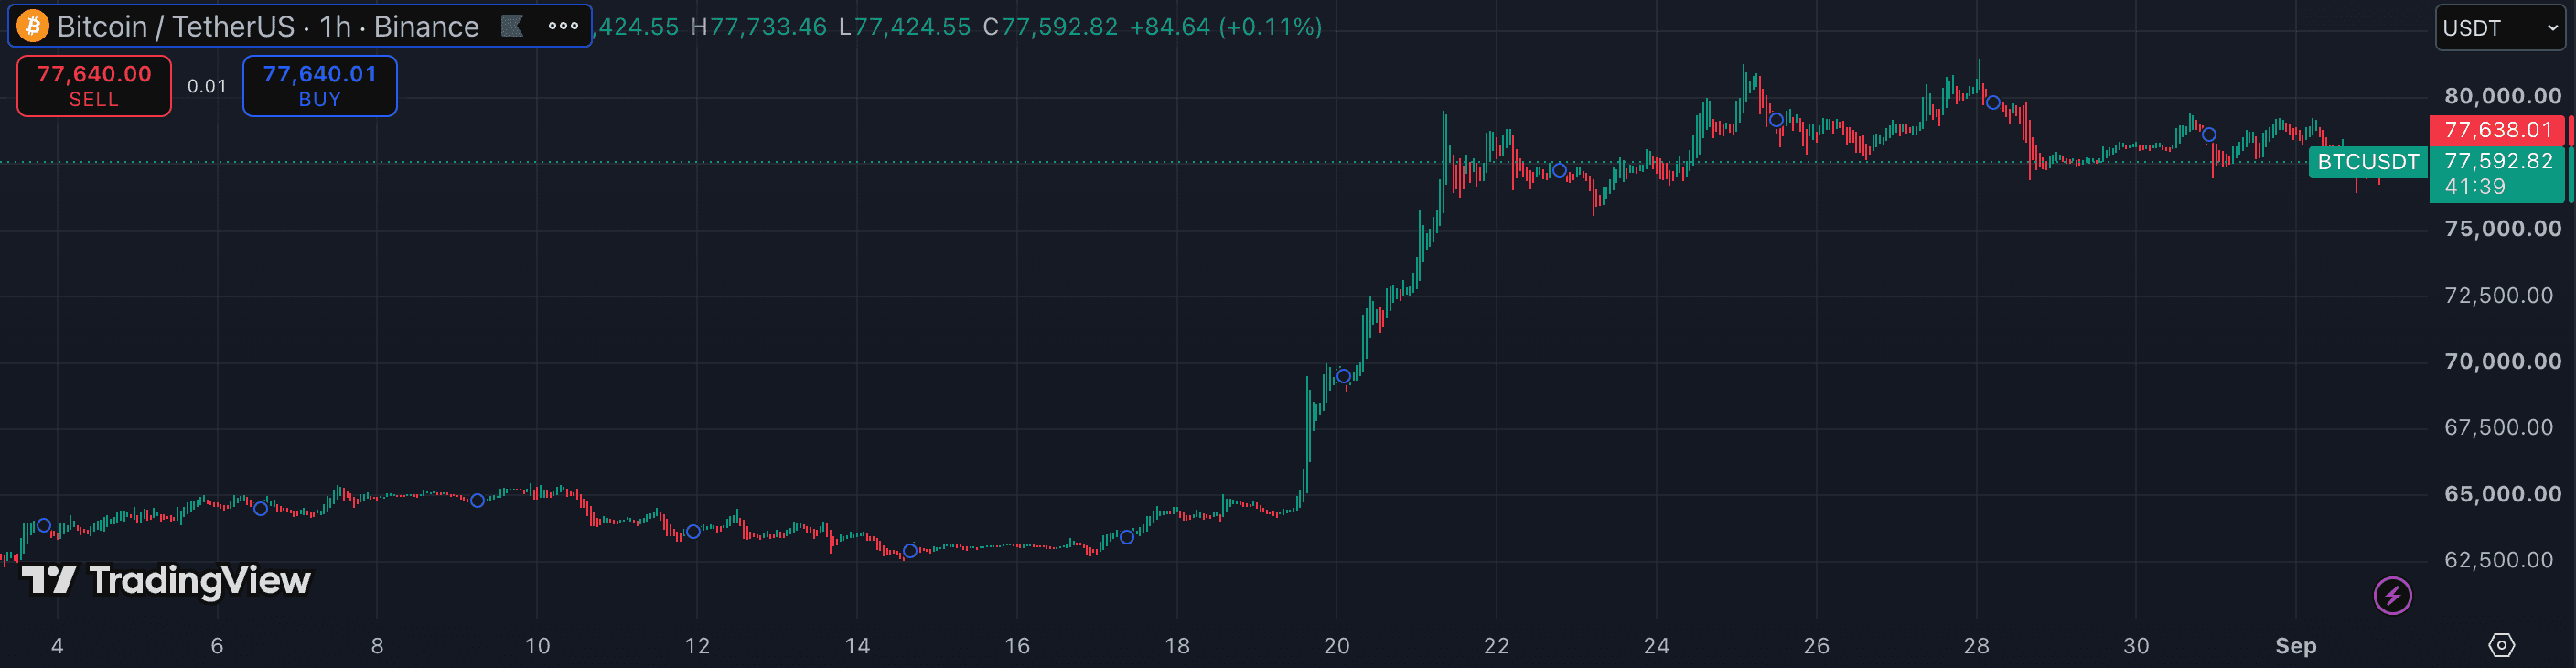
The attributes that matter.
| Attribute | ADX | Heikin Ashi |
|---|---|---|
| Primary question | How strong is the current directional regime? | How persistent does the smoothed visual trend appear? |
| Tool type | Trend-strength oscillator | Alternative candle chart type |
| Core calculation | Smoothed relationship between +DM, −DM, and true range | Averaged current and prior OHLC values |
| Output | ADX line, usually with +DI and −DI | Synthetic candles with colour and wick patterns |
| Directional by itself? | No — ADX alone measures strength | Visually — candle colour suggests smoothed direction |
| Typical timeframe | 1h · 4h · 1D | 1h · 4h · 1D |
| Price precision | Regular candles remain available for real traded prices | Displayed OHLC values are synthetic, not executable prices |
| Primary job | Filter directional methods by regime strength | Reduce visual noise while monitoring trend persistence |
Which should you choose?
ADX is the more diagnostic tool. Its level describes how established directional movement is, while its slope shows whether that strength is increasing or fading. The ADX line remains direction-neutral, so price structure or the +DI/−DI relationship must still supply the directional context. Its advantage is that it adds regime information without replacing the regular price candles.
Heikin Ashi is the clearer visual simplifier. Same-colour runs and changes in wick structure make a noisy trend easier to monitor, but the displayed candles are calculated averages rather than actual traded OHLC values. That smoothing can delay reversals and cannot classify trend strength numerically, so a regular-candle view is still needed for exact prices and structure.
For a chart that already has a directional method, ADX is usually the better first addition because it answers the separate question of trend strength while preserving real-price context. Choose Heikin Ashi when the main problem is visual noise and you want a simpler trend-persistence view. They can also work together, with ADX describing the regime and Heikin Ashi simplifying its appearance, but neither removes the need to check regular candles.
- You already read direction from price or another overlay and need a strength filter
- You want to identify low-strength conditions without replacing regular candles
- You are comfortable interpreting ADX slope alongside +DI and −DI
- You want the simplest visual read of trend persistence and candle noise
- You monitor 1h–1D trends through colour runs and wick changes
- You keep a separate regular-candle chart for exact prices and structure
Other comparisons
Not investment advice. PineRadar is an editorial directory — links may be affiliate. Always test indicators on a demo account.