ADXvsIchimoku Cloud
ADX and Ichimoku Cloud are both used in trend analysis, but they solve different parts of the problem. ADX compresses directional strength into an oscillator reading and leaves direction to price or the DI lines; Ichimoku places a multi-part framework over price to show direction, momentum, and possible support or resistance. This comparison helps choose between a regime filter and a complete chart overlay. Educational content only; not financial advice.
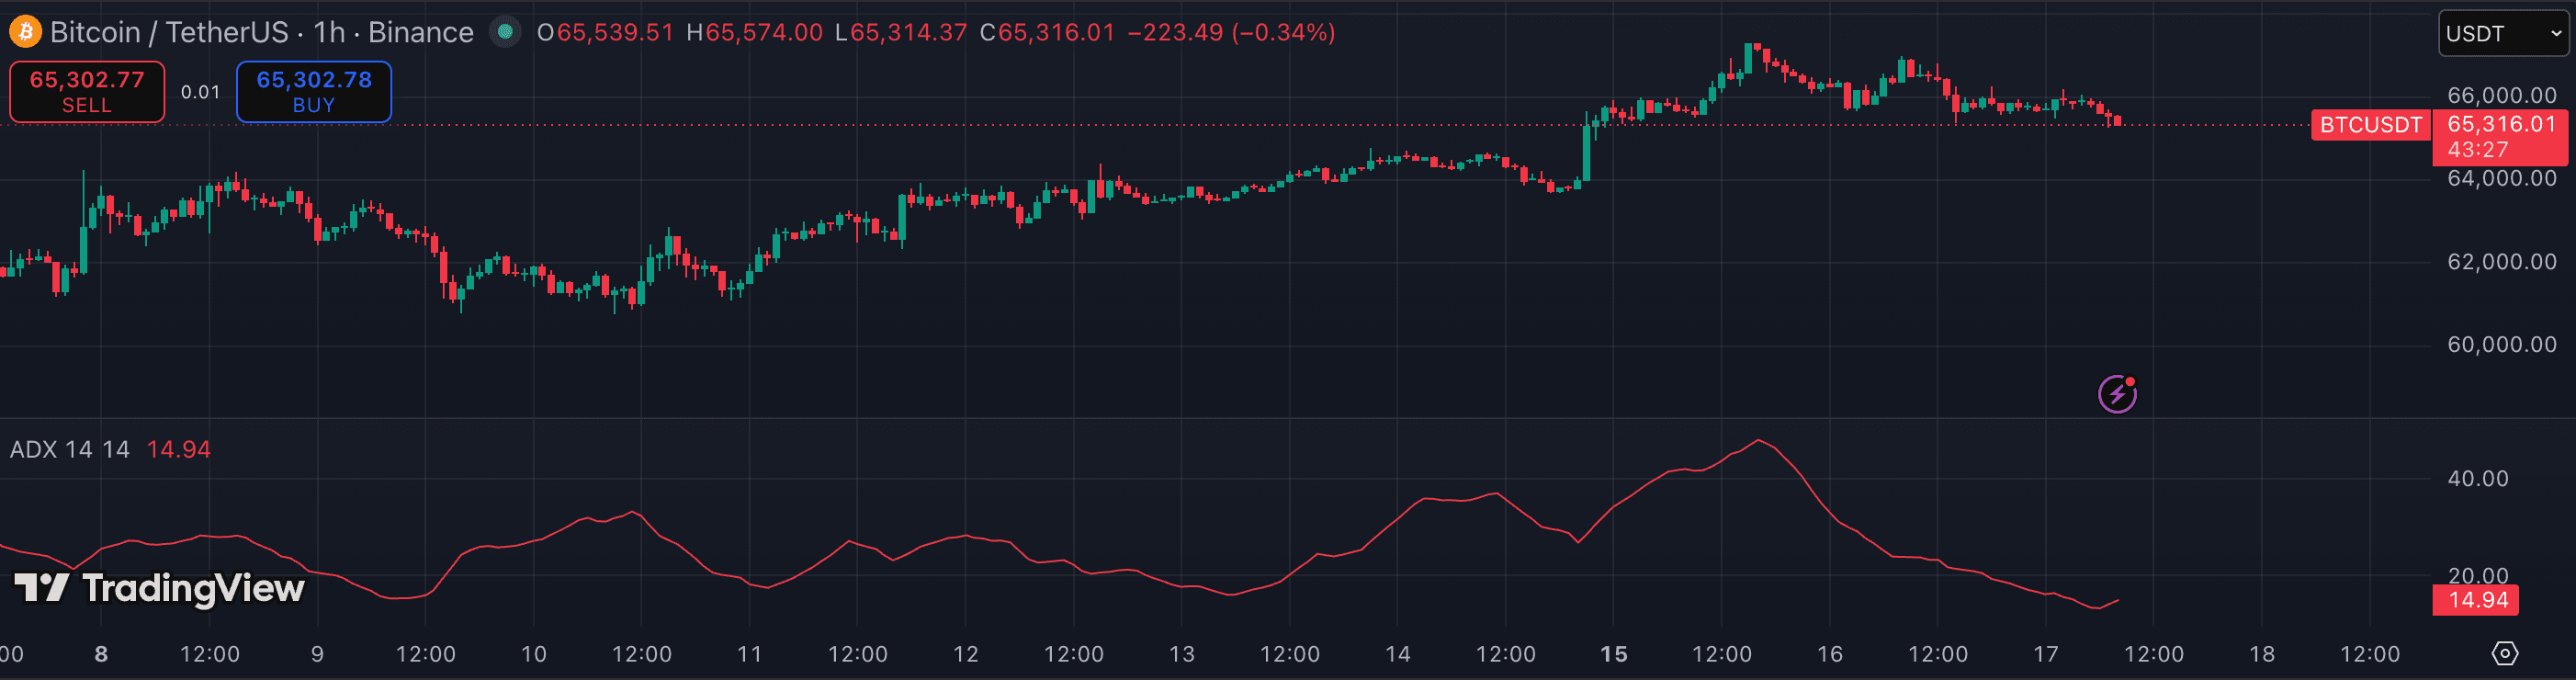
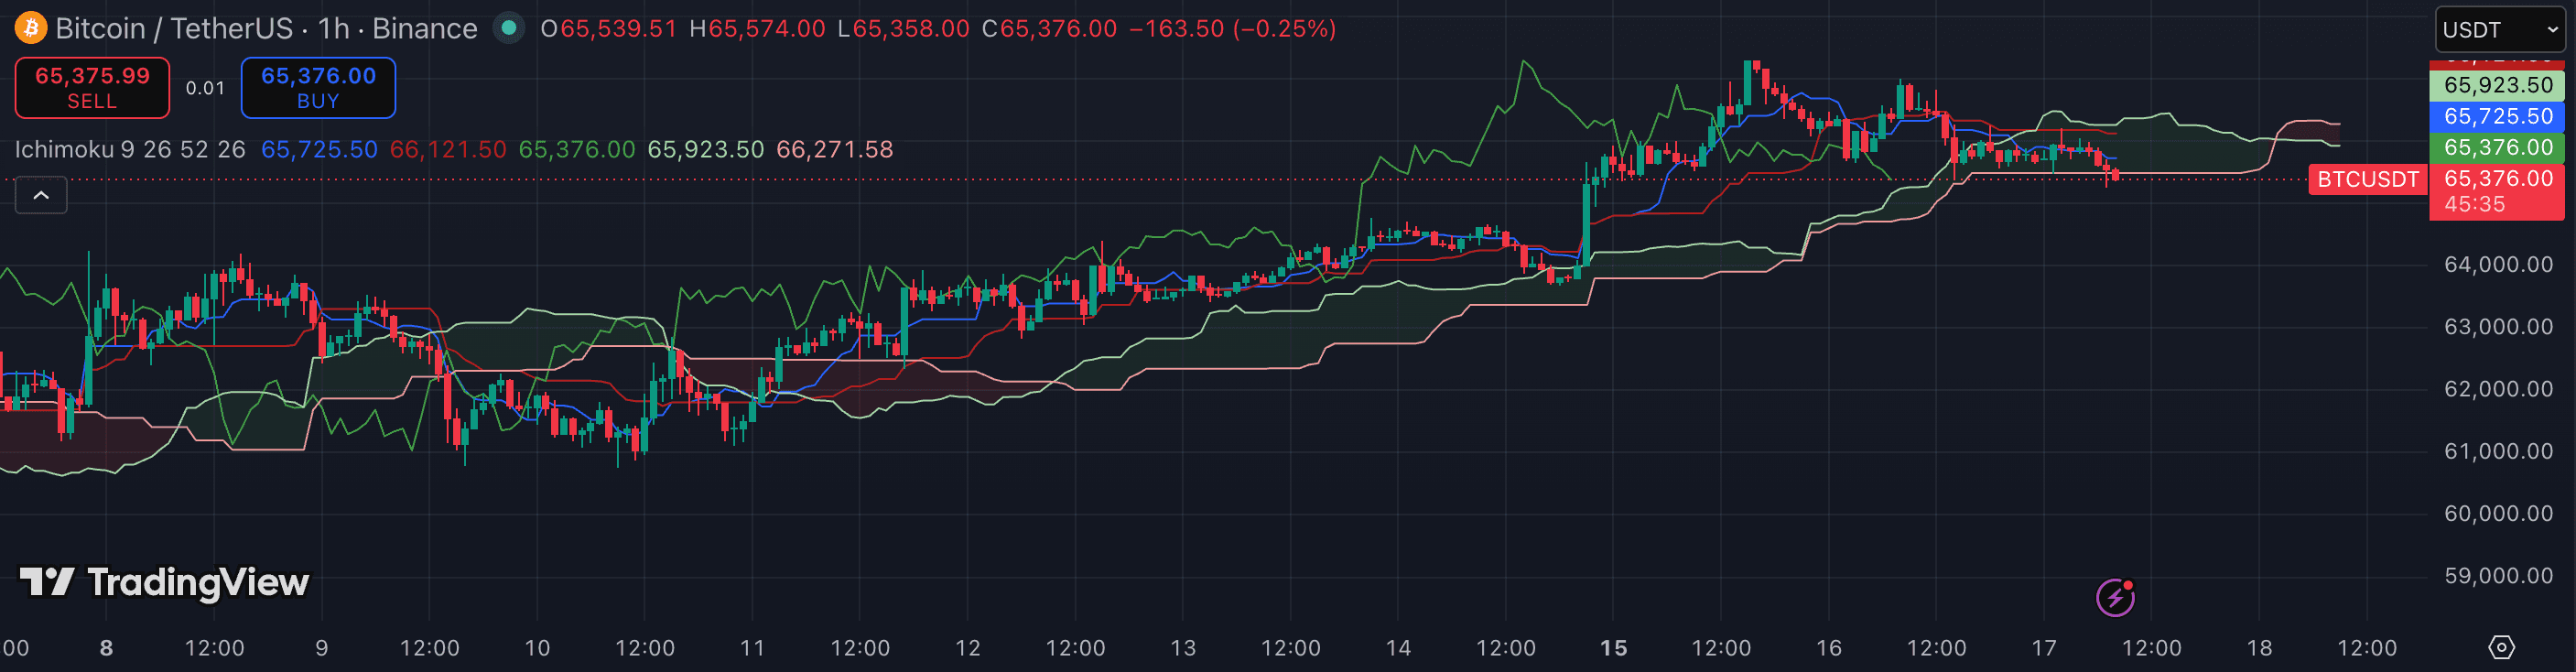
The attributes that matter.
| Attribute | ADX | Ichimoku Cloud |
|---|---|---|
| Primary question | How strong is the directional regime? | What is the trend structure and where are its reference levels? |
| Chart location | Separate oscillator pane | Five-line overlay on price |
| Output | ADX, usually alongside +DI and −DI | Conversion line, Base line, cloud spans, and Lagging Span |
| Directional by itself? | No — ADX measures strength, not direction | Yes — price and line position frame direction |
| Typical timeframe | 1h · 4h · 1D | 4h · 1D · 1W |
| Price levels | None | Cloud and Base line provide dynamic reference zones |
| Complexity | Moderate — strength, slope, and DI context | High — several components interact |
| Primary job | Filter trend tools by regime strength | Build a higher-timeframe trend framework |
Which should you choose?
ADX is the more focused tool. Its level describes how established a directional regime is, while its slope shows whether that strength is building or fading. Because the ADX line itself is direction-neutral, a high reading can accompany either an upward or downward move; price structure or +DI/−DI context is still needed before the reading has directional meaning.
Ichimoku Cloud provides much more chart context. Price relative to the cloud frames the broad trend, the Conversion and Base lines compare faster and slower equilibrium, and the projected cloud marks possible future support or resistance zones. That breadth can replace several separate overlays on higher timeframes, but it takes longer to learn and can obscure the candles when every component is displayed at once.
For a self-contained higher-timeframe trend framework, Ichimoku Cloud is usually the better first choice because it supplies direction and price-level context that ADX does not. Choose ADX when the chart already has a directional method and the missing question is whether the market is trending strongly enough for that method to be useful. They can work together, with Ichimoku defining the directional structure and ADX describing regime strength, but agreement is still descriptive rather than predictive.
- You already have a directional overlay and need a separate strength filter
- You want to distinguish a developing trend from low-strength chop
- You prefer a compact oscillator to another multi-line price overlay
- You want direction, momentum, and dynamic levels in one framework
- You analyse 4h–1W charts and can learn several interacting components
- You need projected cloud zones rather than a direction-neutral strength value
Other comparisons
Not investment advice. PineRadar is an editorial directory — links may be affiliate. Always test indicators on a demo account.