Parabolic SARvsHeikin Ashi
Parabolic SAR and Heikin Ashi both make trend direction visually obvious, but they do different jobs. Parabolic SAR plots an accelerating stop-and-reverse reference over regular prices; Heikin Ashi transforms the candles into an averaged series that suppresses short-term noise. This comparison separates a mechanical trailing overlay from a smoothed trend-reading chart. Educational content only; not financial advice.
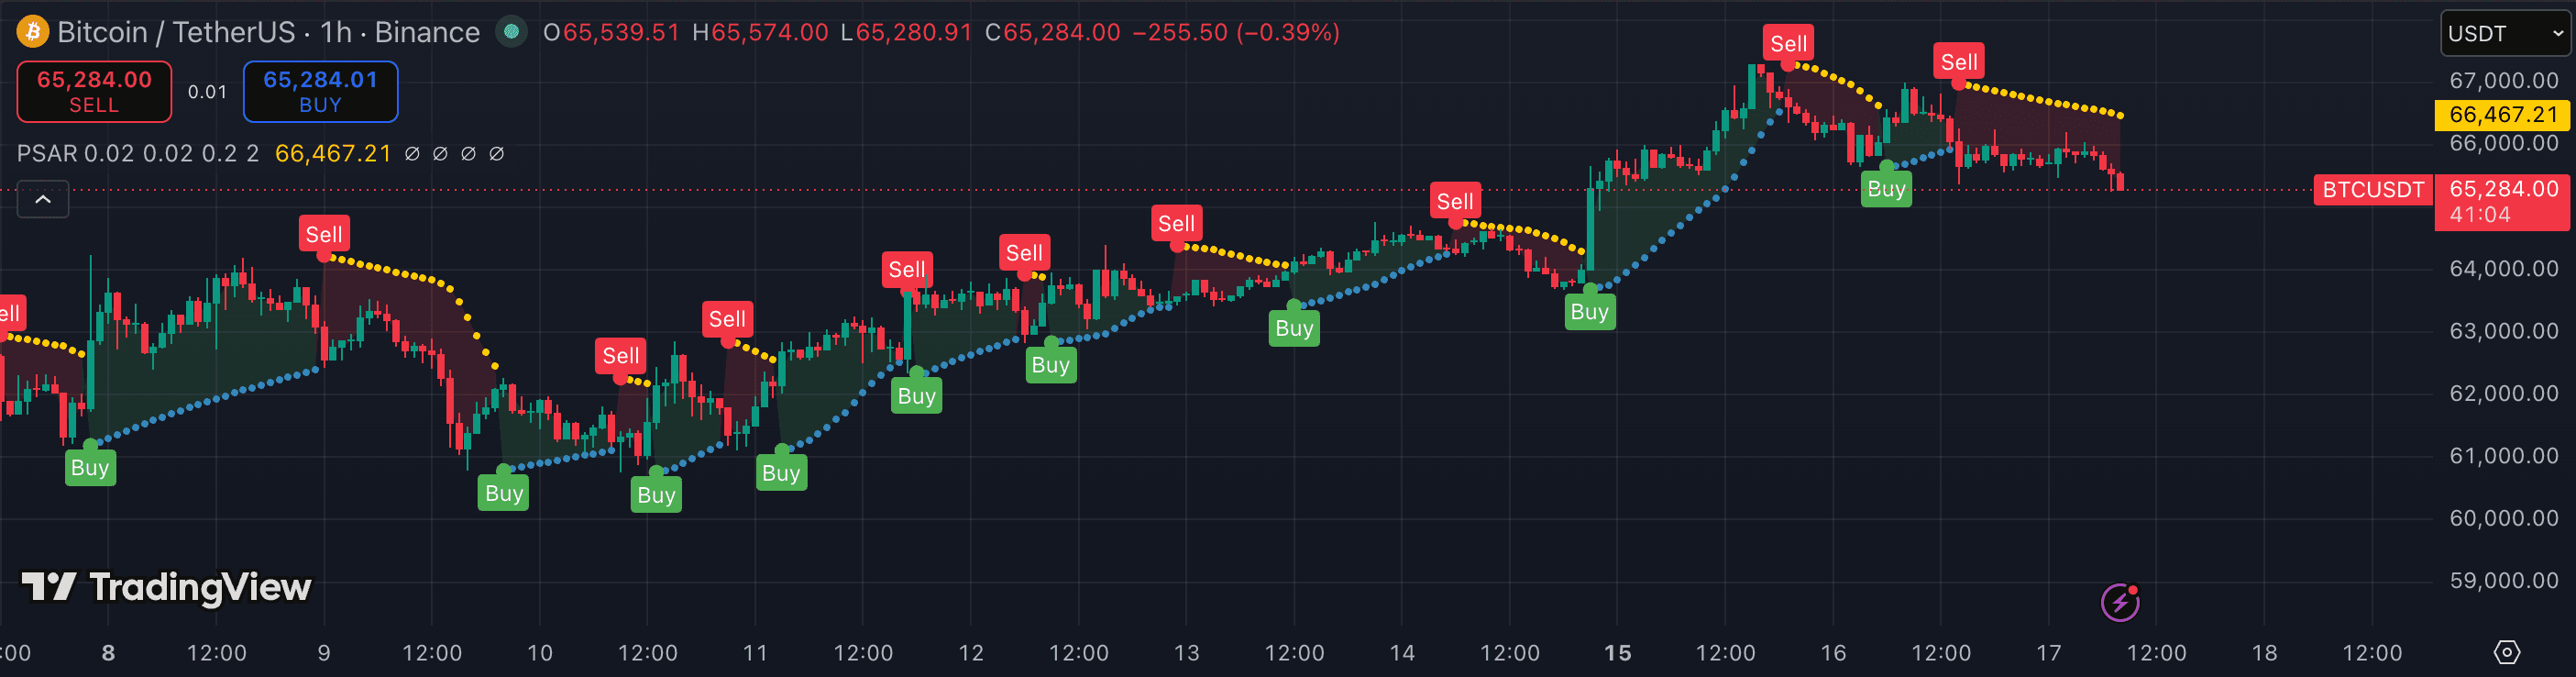
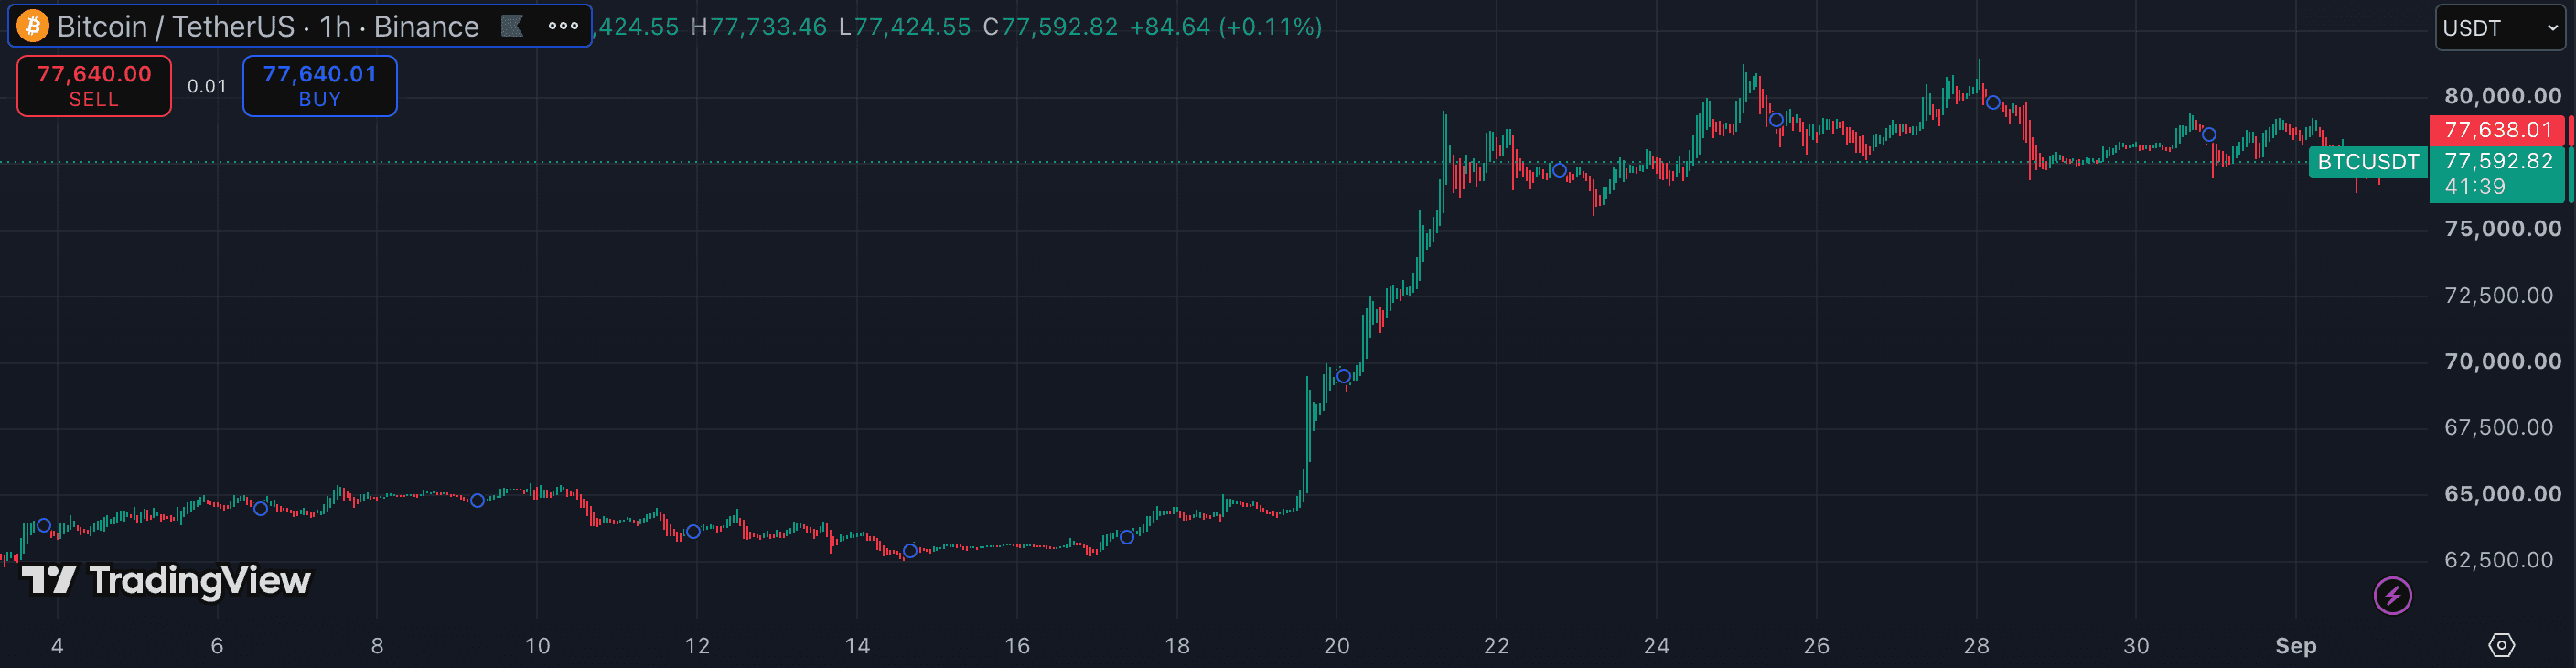
The attributes that matter.
| Attribute | Parabolic SAR | Heikin Ashi |
|---|---|---|
| Tool type | Stop-and-reverse trailing overlay | Alternative candle chart type |
| Core calculation | Prior SAR adjusted toward the trend's extreme point | Averaged current and prior OHLC values |
| Output | Dots that alternate above and below price | Synthetic candles with colour and wick patterns |
| Directional read | Dot position relative to regular candles | Smoothed candle colour and shadow structure |
| Trailing reference | Yes — the dots accelerate as a move extends | No — candle changes provide context, not a mechanical level |
| Typical timeframe | 1h · 4h · 1D | 1h · 4h · 1D |
| Price precision | Regular candles remain visible beneath the overlay | Displayed OHLC values are synthetic |
| Main limitation | Frequent side flips in sideways markets | Smoothing can hide brief corrections and delay turns |
Which should you choose?
Parabolic SAR is the more mechanical tool. Its acceleration factor moves the dots progressively closer to the trend's extreme point, creating an unambiguous trailing reference that eventually flips sides. That clarity is useful only after a directional regime has been established; in a range, the same formula can generate repeated flips as price moves back and forth.
Heikin Ashi is designed for visual continuity rather than a trailing level. Averaged candles turn sustained movement into cleaner same-colour sequences and make changes in wick structure easier to scan. The trade-off is price fidelity: Heikin Ashi opens and closes are synthetic, so the chart can describe a smoothed trend but cannot replace regular candles for exact levels.
For general trend monitoring, Heikin Ashi is usually the better first choice because it provides a calmer view without requiring the dots to act as a mechanical trailing rule. Choose Parabolic SAR when a trend is already defined and the specific need is an accelerating trailing reference. A combined workflow can read trend persistence from Heikin Ashi and inspect SAR on a regular-candle chart, rather than treating either visual change as a standalone instruction.
- You want a mechanical trailing reference that tightens as a trend extends
- You prefer explicit dot flips over interpreting candle sequences
- You already use price structure or another method to filter sideways conditions
- You want a cleaner visual summary of trend persistence on 1h–1D charts
- You prefer colour runs and wick changes to a separate trailing overlay
- You can check regular candles whenever exact prices or structure matter
Other comparisons
Not investment advice. PineRadar is an editorial directory — links may be affiliate. Always test indicators on a demo account.