Order BlocksvsPivot Points
Order Blocks and Pivot Points both place possible reaction areas on a price chart, but they are built very differently. Order Block scripts infer zones from swing and displacement logic that varies by implementation; Pivot Points calculate fixed levels from a prior period's prices. This comparison separates an interpretive structure overlay from a repeatable intraday map. Educational content only; not financial advice.
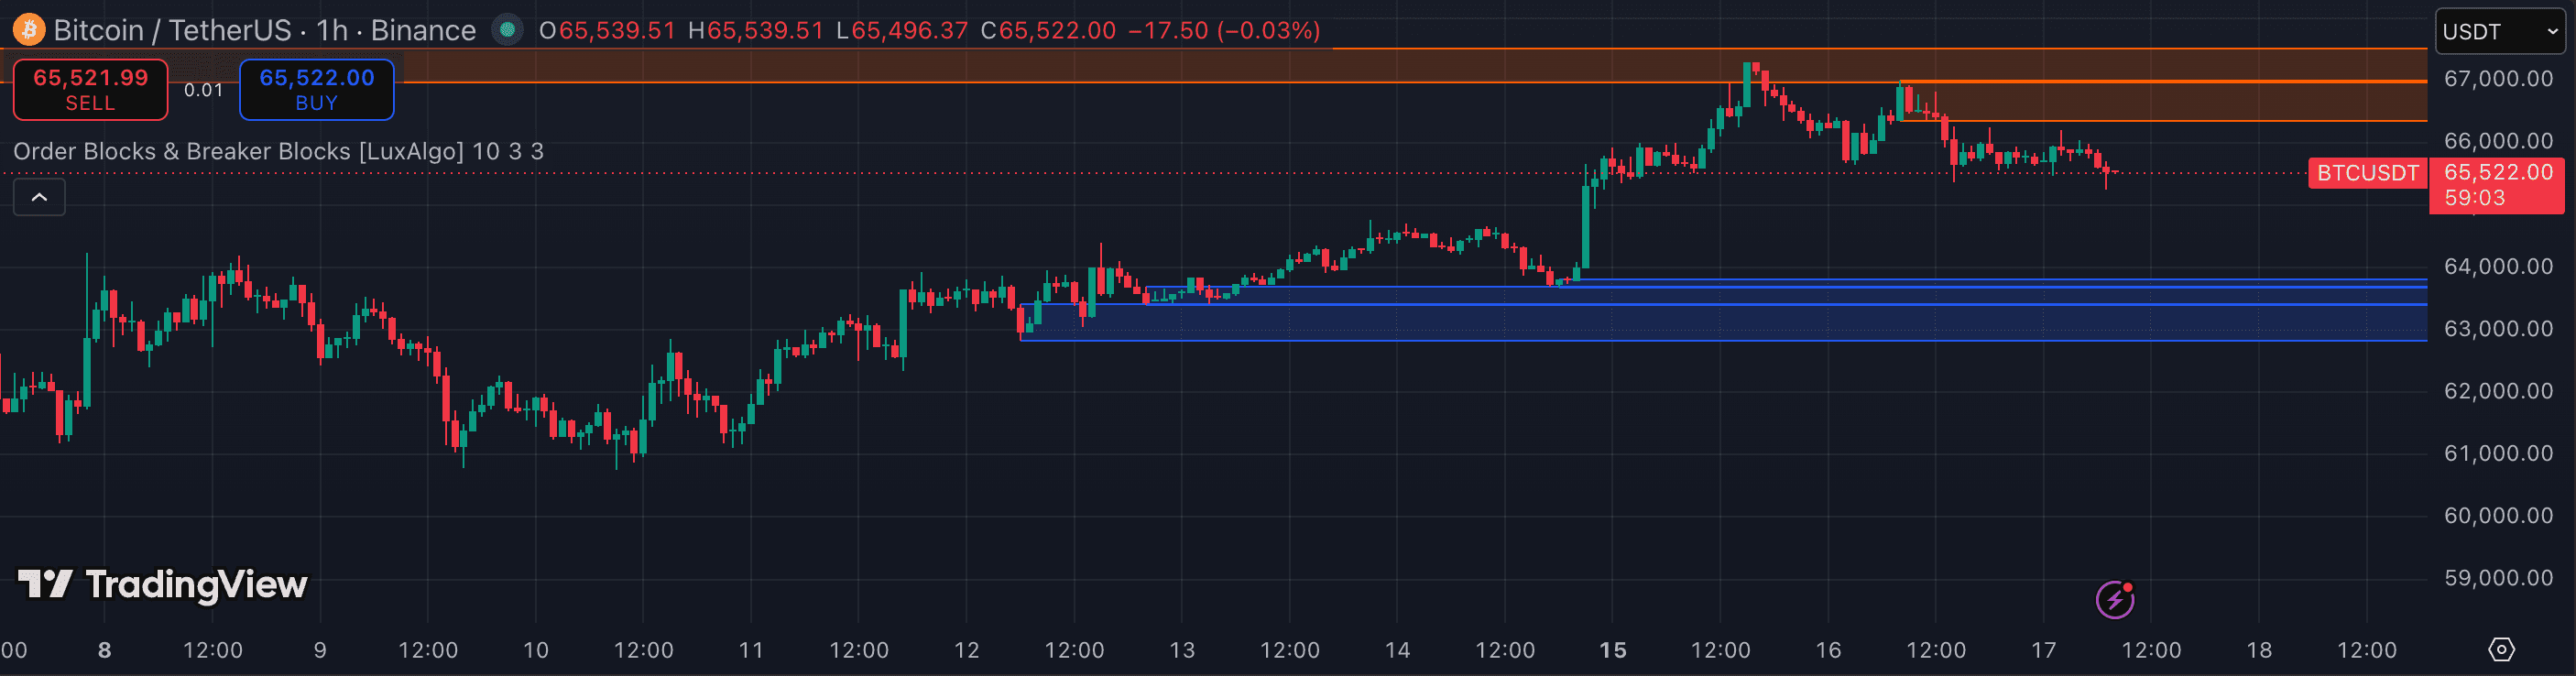
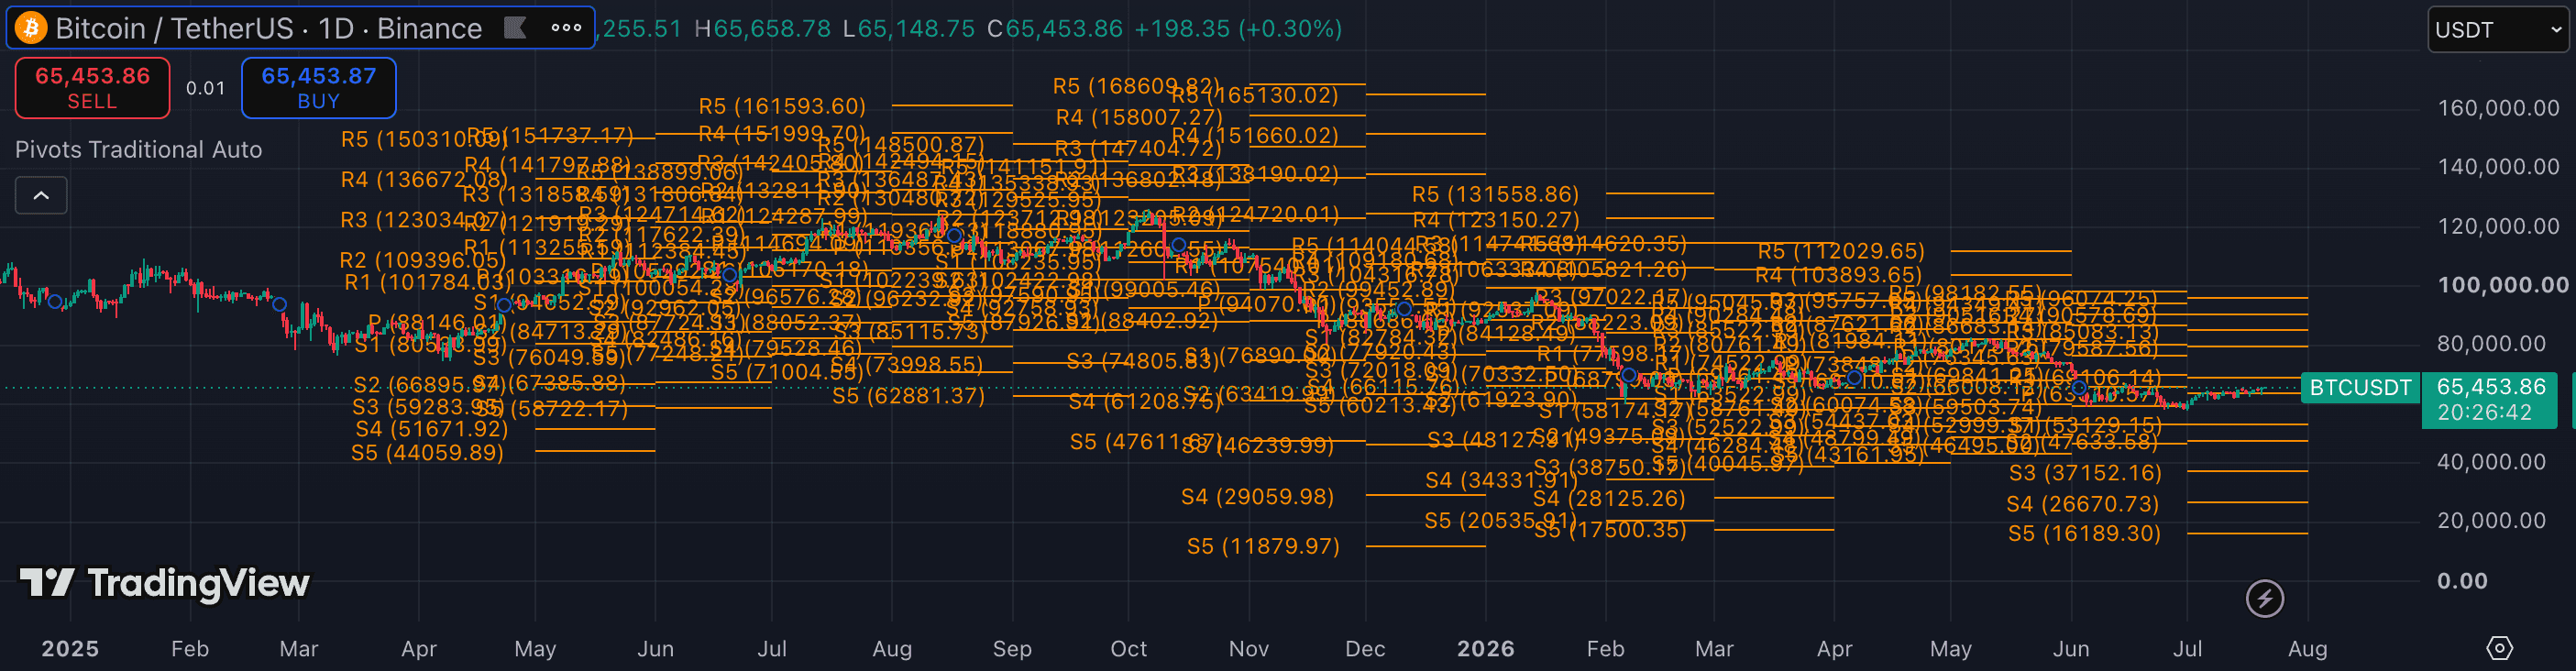
The attributes that matter.
| Attribute | Order Blocks | Pivot Points |
|---|---|---|
| Tool type | Script-defined supply/demand zone overlay | Formula-based horizontal level overlay |
| Core input | Swing structure, opposing candles, displacement, and mitigation rules | Prior period high, low, and close |
| Output | Zones, often alongside BOS, CHoCH, or fair value gaps | Central pivot with support and resistance levels |
| Standardisation | Low — detection rules vary across scripts and settings | High once formula variant and anchor period are selected |
| Typical timeframe | 5m · 15m · 1h | 5m · 15m · 1h |
| Level lifecycle | Zones persist until script-defined mitigation or invalidation | Levels reset when the selected session or anchor period changes |
| Primary job | Review possible reaction zones within an SMC-style structure workflow | Pre-map mechanical intraday reference levels |
| Main limitation | Zone selection can change materially between scripts and sensitivities | Levels provide no direction or confirmation and depend on the chosen session convention |
Which should you choose?
Order Block tools provide richer structural annotation. A script may mark the last opposing candle before displacement, extend that area as a zone, and remove or restyle it after mitigation. That can help organise an SMC-style chart, but there is no single universal detection rule: swing sensitivity, displacement filters, and invalidation logic can make two scripts draw different zones on the same market.
Pivot Points are more mechanical. Once the formula variant and anchor period are fixed, the central pivot and surrounding support or resistance levels are reproducible from the prior period's high, low, and close. The levels are available before the new period develops, but they do not explain whether price will react, and 24/7 crypto markets require a consistent session boundary.
For a first intraday structure tool, Pivot Points are usually the better choice because the calculation is transparent, built into TradingView, and easy to reproduce. Choose Order Blocks when you specifically want zone-based SMC annotations and are prepared to audit the script's detection and mitigation rules. Either tool needs independent price and regime context; drawing more levels does not make a reaction certain.
- You use an SMC-style workflow and want zones rather than single prices
- You are willing to compare script rules and tune swing sensitivity
- You need mitigation-aware areas alongside structure labels
- You want transparent levels derived from the prior period's prices
- You need a repeatable intraday map that resets on a defined schedule
- You prefer a built-in tool with fewer interpretive settings
Other comparisons
Not investment advice. PineRadar is an editorial directory — links may be affiliate. Always test indicators on a demo account.