Parabolic SARvsIchimoku Cloud
Parabolic SAR and Ichimoku Cloud are trend overlays with very different scope. Parabolic SAR supplies an accelerating stop-and-reverse reference, while Ichimoku combines direction, momentum, and projected support or resistance in a five-part framework. This comparison separates a focused trailing tool from a broader higher-timeframe system. Educational content only; not financial advice.
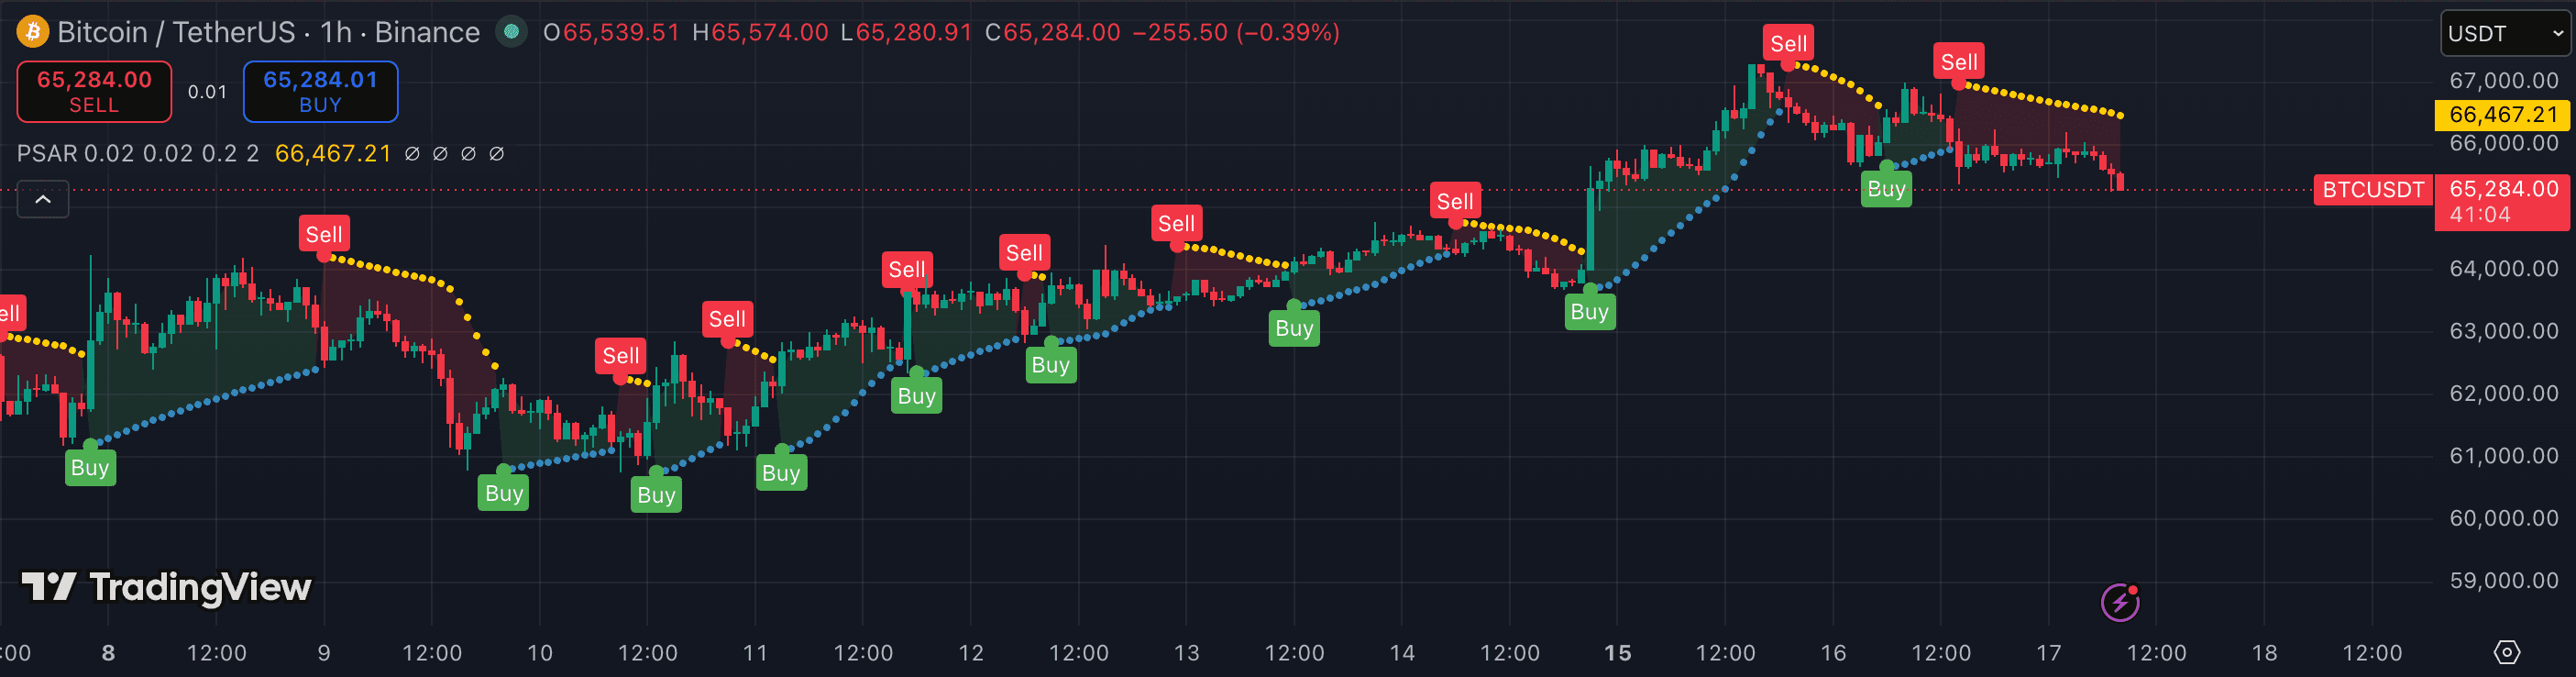
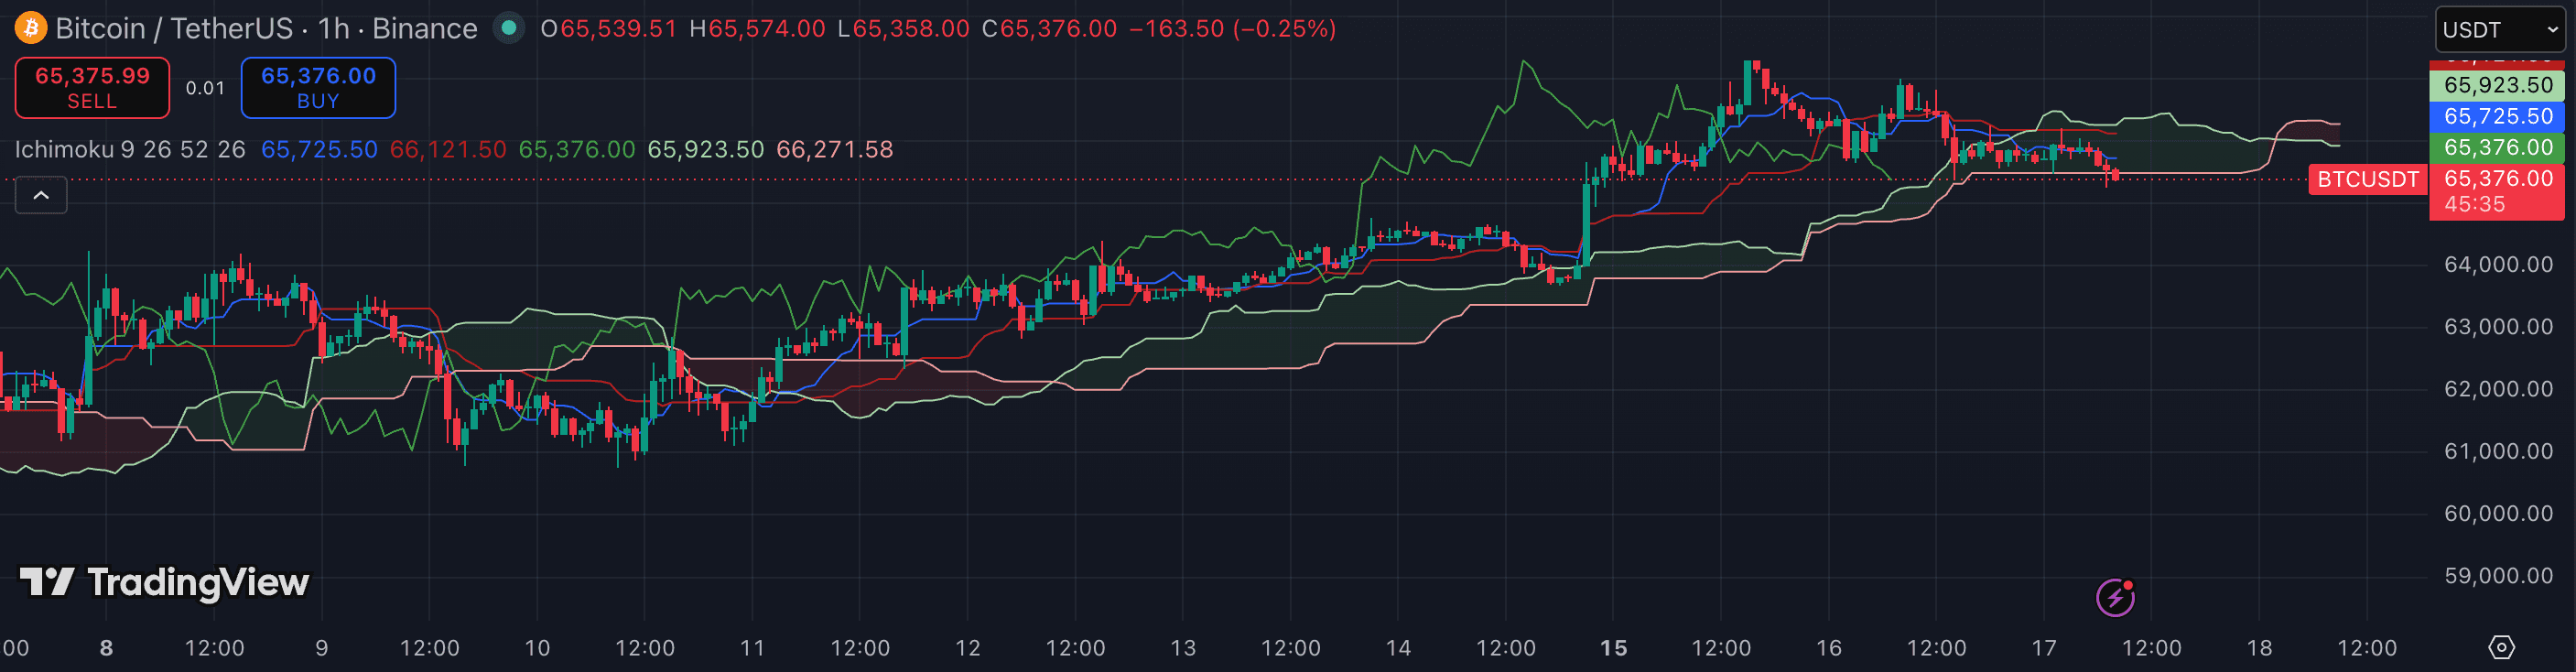
The attributes that matter.
| Attribute | Parabolic SAR | Ichimoku Cloud |
|---|---|---|
| Tool type | Stop-and-reverse trailing overlay | Multi-part trend framework |
| Core calculation | Prior SAR adjusted toward the trend's extreme point | Midpoint ranges using 9, 26, and 52-period defaults |
| Output | Dots that alternate above and below price | Conversion line, Base line, cloud spans, and Lagging Span |
| Primary question | Where is the accelerating trailing reference? | What are the trend, momentum, and reference zones? |
| Typical timeframe | 1h · 4h · 1D | 4h · 1D · 1W |
| Forward context | No — dots trail the active move | Yes — the cloud is projected ahead |
| Complexity | Low — dot position and flips | High — several components interact |
| Main limitation | Frequent side flips in sideways conditions | Dense display and ambiguous reads inside the cloud |
Which should you choose?
Parabolic SAR is the narrower and more mechanical tool. Its acceleration factor moves the dots progressively toward the trend's extreme point, creating a trailing reference that tightens as a move extends. The calculation assumes directional persistence, so repeated side flips are common when price is moving sideways rather than trending.
Ichimoku Cloud provides a fuller analytical framework. Price relative to the cloud frames direction, the Conversion and Base lines add shorter- and medium-horizon context, and the projected cloud marks possible future reference zones. That breadth makes it useful for higher-timeframe analysis, but it requires more interpretation and can become visually dense when price is inside the cloud.
For a first higher-timeframe trend framework, Ichimoku Cloud is usually the better choice because it supplies direction, momentum context, and projected zones rather than only a trailing level. Choose Parabolic SAR when another method has already identified the trend and the specific need is a simple accelerating reference. The two can be combined, with Ichimoku defining context and SAR trailing the established move, but neither turns a visual state into certainty.
- You already have a trend framework and need a focused trailing reference
- You prefer simple dots and explicit side flips over a multi-line overlay
- You can filter sideways conditions with structure or another regime tool
- You want direction, momentum context, and projected zones in one framework
- You analyse 4h–1W charts and can learn several interacting components
- You need a primary trend system rather than only a trailing reference
Other comparisons
Not investment advice. PineRadar is an editorial directory — links may be affiliate. Always test indicators on a demo account.