Moving AveragevsParabolic SAR
Moving Averages and Parabolic SAR both add a trend reference directly to the price chart, but they update in different ways. A Moving Average smooths past prices into a continuous line; Parabolic SAR trails price with accelerating dots that flip sides when its stop-and-reverse logic changes direction. This comparison separates a flexible trend baseline from a more mechanical trailing framework. Educational content only; not financial advice.
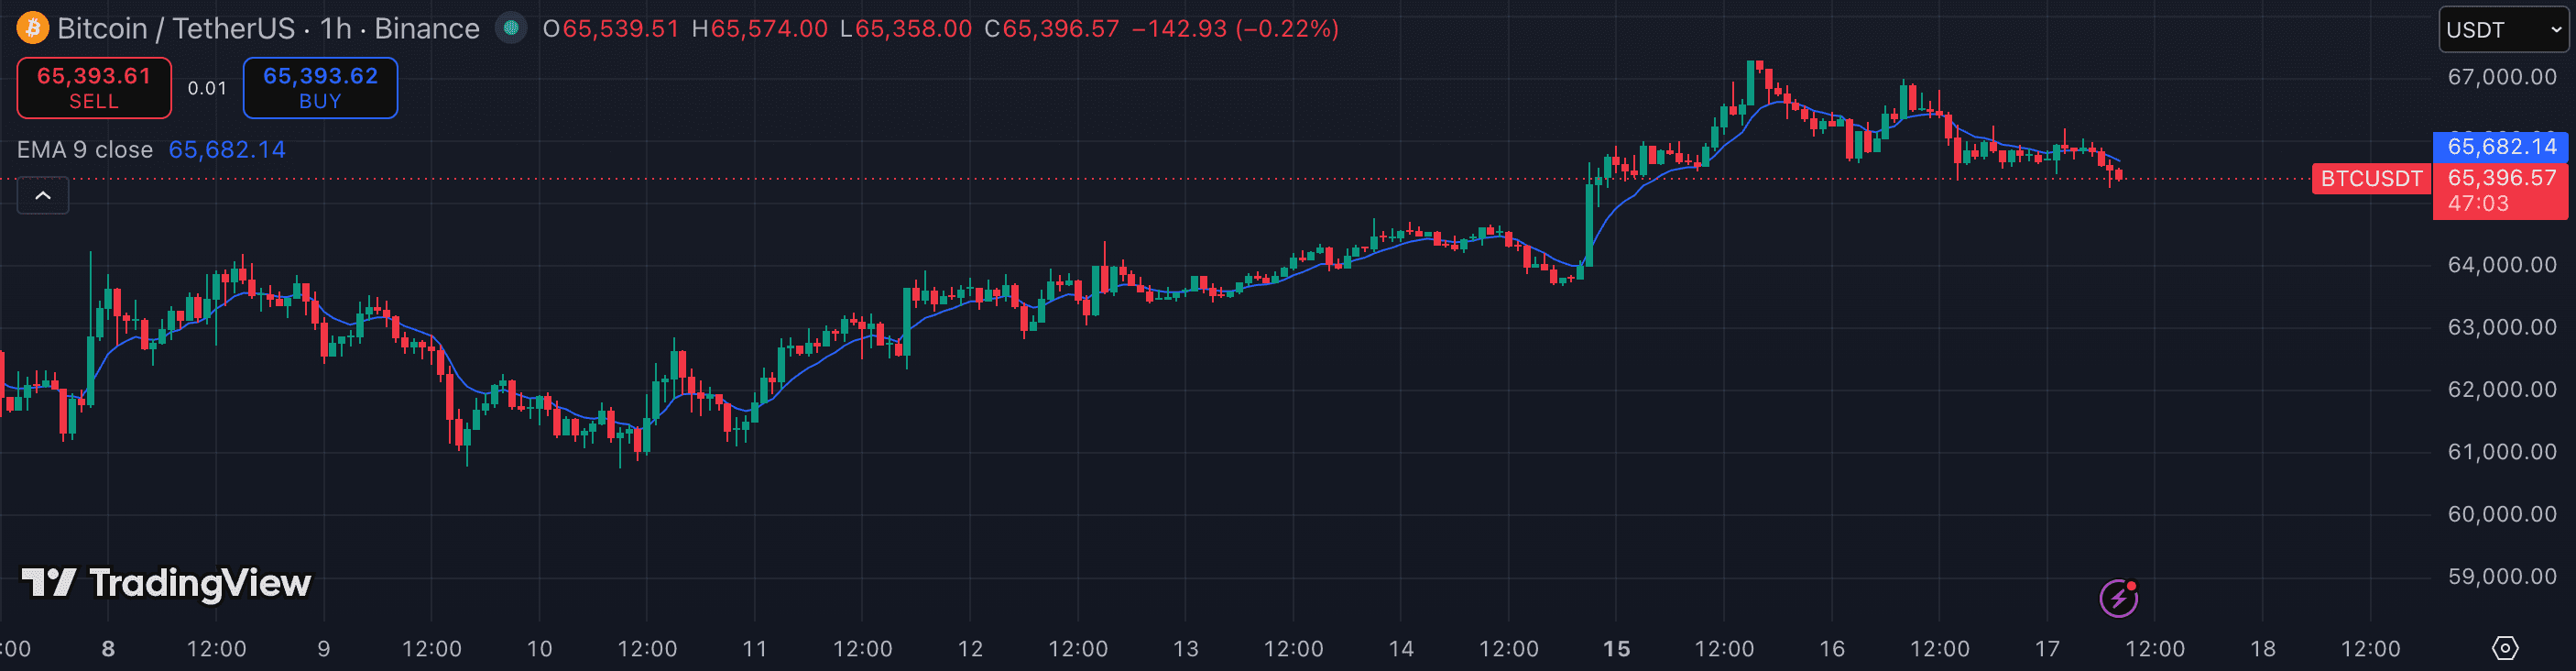
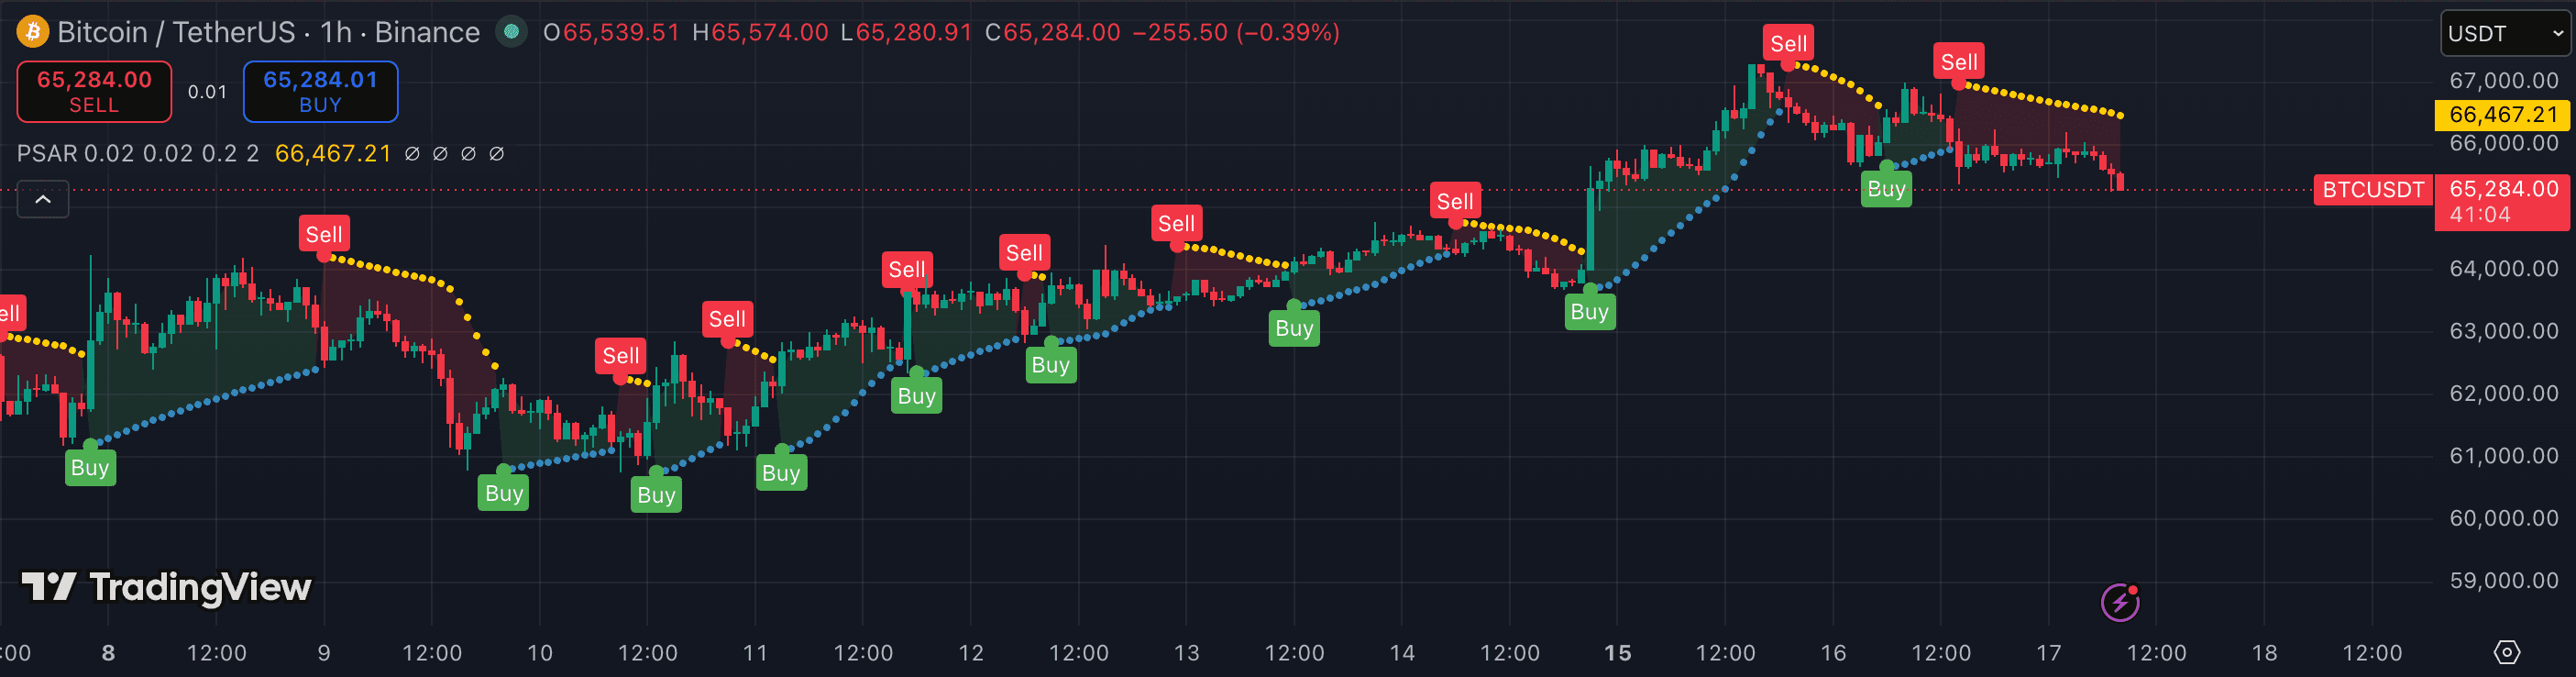
The attributes that matter.
| Attribute | Moving Average | Parabolic SAR |
|---|---|---|
| Tool type | Smoothed trend baseline | Stop-and-reverse trailing overlay |
| Core calculation | Average of recent prices; weighting depends on MA type | Prior SAR plus an accelerating fraction of the extreme point |
| Output | One or more continuous lines over price | Dots that alternate above and below price |
| Directional read | Line slope and price position | Dot position relative to price |
| Typical timeframe | 15m · 1h · 4h · 1D | 1h · 4h · 1D |
| Sensitivity control | Average type and lookback length | Acceleration factor and maximum step |
| Range handling | Repeated crosses when the average flattens | Frequent side flips as price moves sideways |
| Primary job | Trend direction and pullback context | Mechanical trailing and possible trend-flip reference |
Which should you choose?
A Moving Average is the broader chart-reading tool. Its slope shows the direction of the smoothed trend, price position supplies pullback context, and changing the average type or length lets the same concept cover short- and long-horizon analysis. That flexibility does not remove lag, and a flat line with repeated price crosses is a warning that the market may not be trending cleanly.
Parabolic SAR is more prescriptive. Its dots move toward the trend's extreme point at an increasing rate, so the reference tightens as a directional move extends and flips sides when the stop-and-reverse calculation is crossed. The clear dot sequence is useful for a mechanical trailing workflow, but it can change sides repeatedly in a range because the formula assumes persistent movement.
For a first trend overlay, the Moving Average is usually the better choice because it provides a simple directional baseline across more market conditions. Choose Parabolic SAR when the specific need is an accelerating trailing reference after a trend has already been identified. A combined workflow can use the Moving Average for direction and apply SAR only when price and slope show a sufficiently clear trend; neither tool should be treated as a complete decision rule on its own.
- You want one adaptable line for trend direction and pullback context
- You compare short-, medium-, or long-term trends by changing the lookback
- You prefer to identify a trend before choosing a separate trailing method
- You want a mechanical trailing reference that tightens as a trend extends
- You prefer unambiguous dots and side flips over interpreting line slope
- You already filter out sideways conditions with price structure or another tool
Other comparisons
Not investment advice. PineRadar is an editorial directory — links may be affiliate. Always test indicators on a demo account.