SupertrendvsHeikin Ashi
Supertrend and Heikin Ashi both simplify trend direction into an easy visual state. Supertrend applies an ATR-based trailing line to a regular price chart, while Heikin Ashi recalculates the candles themselves to smooth short-term noise. This comparison explains when a volatility-adjusted overlay is more useful than a cleaner synthetic candle view. Educational content only; not financial advice.
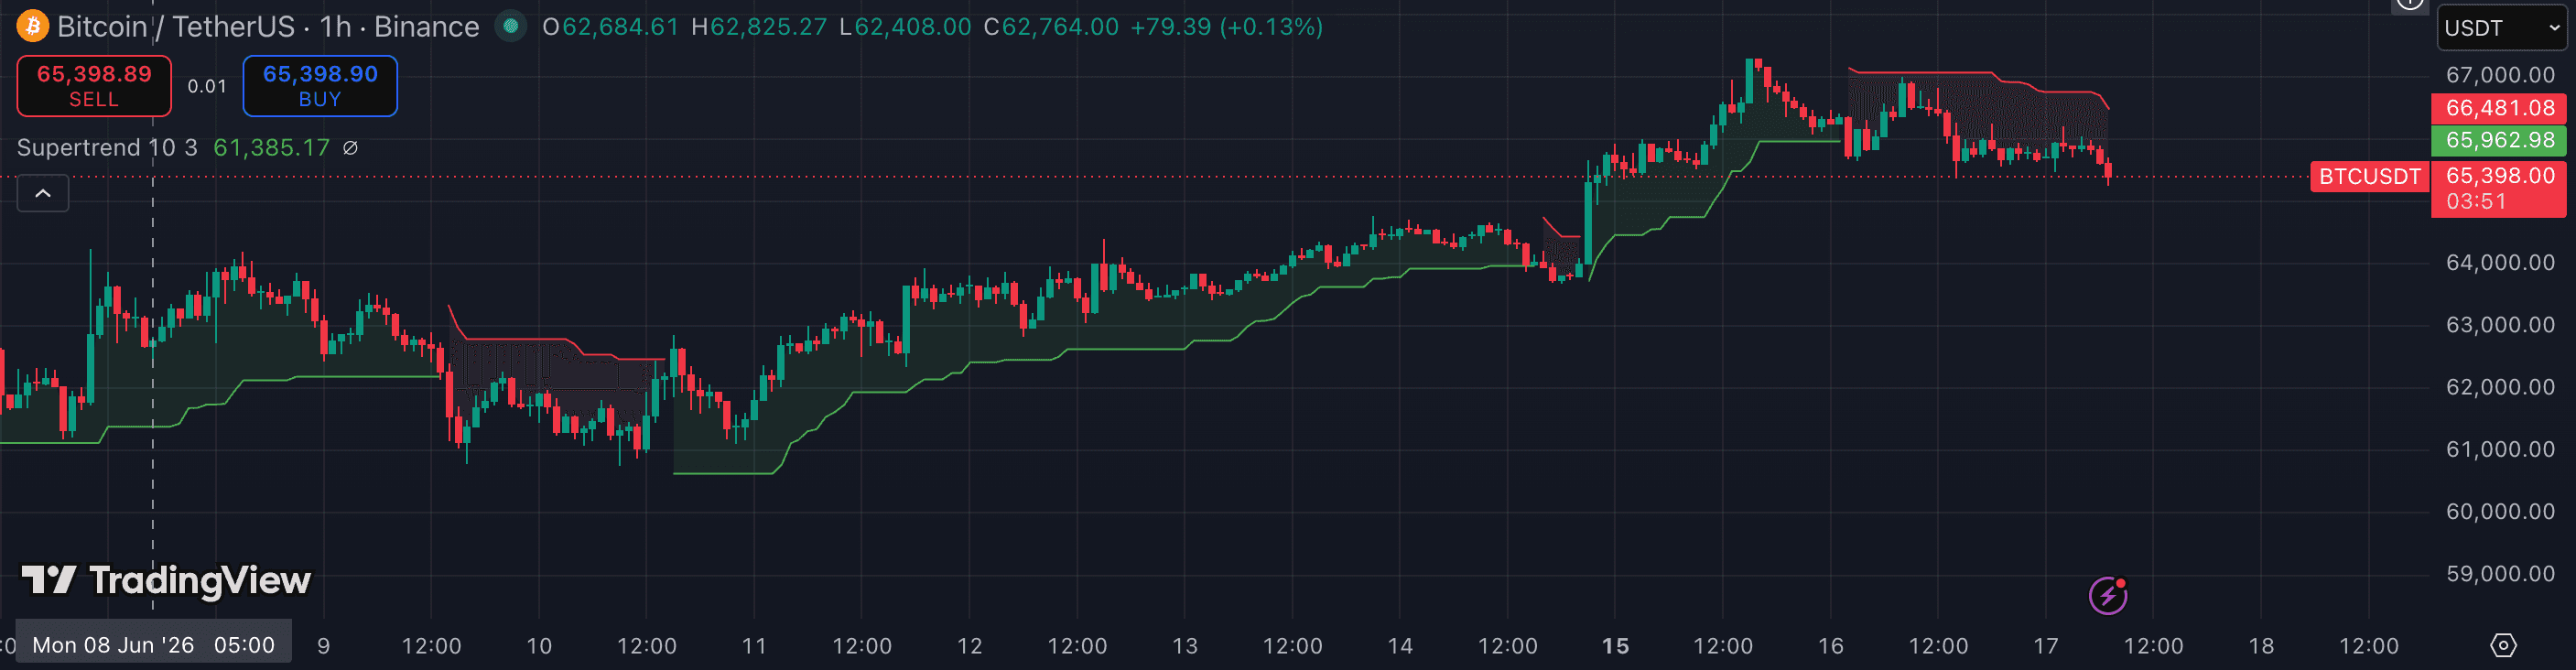
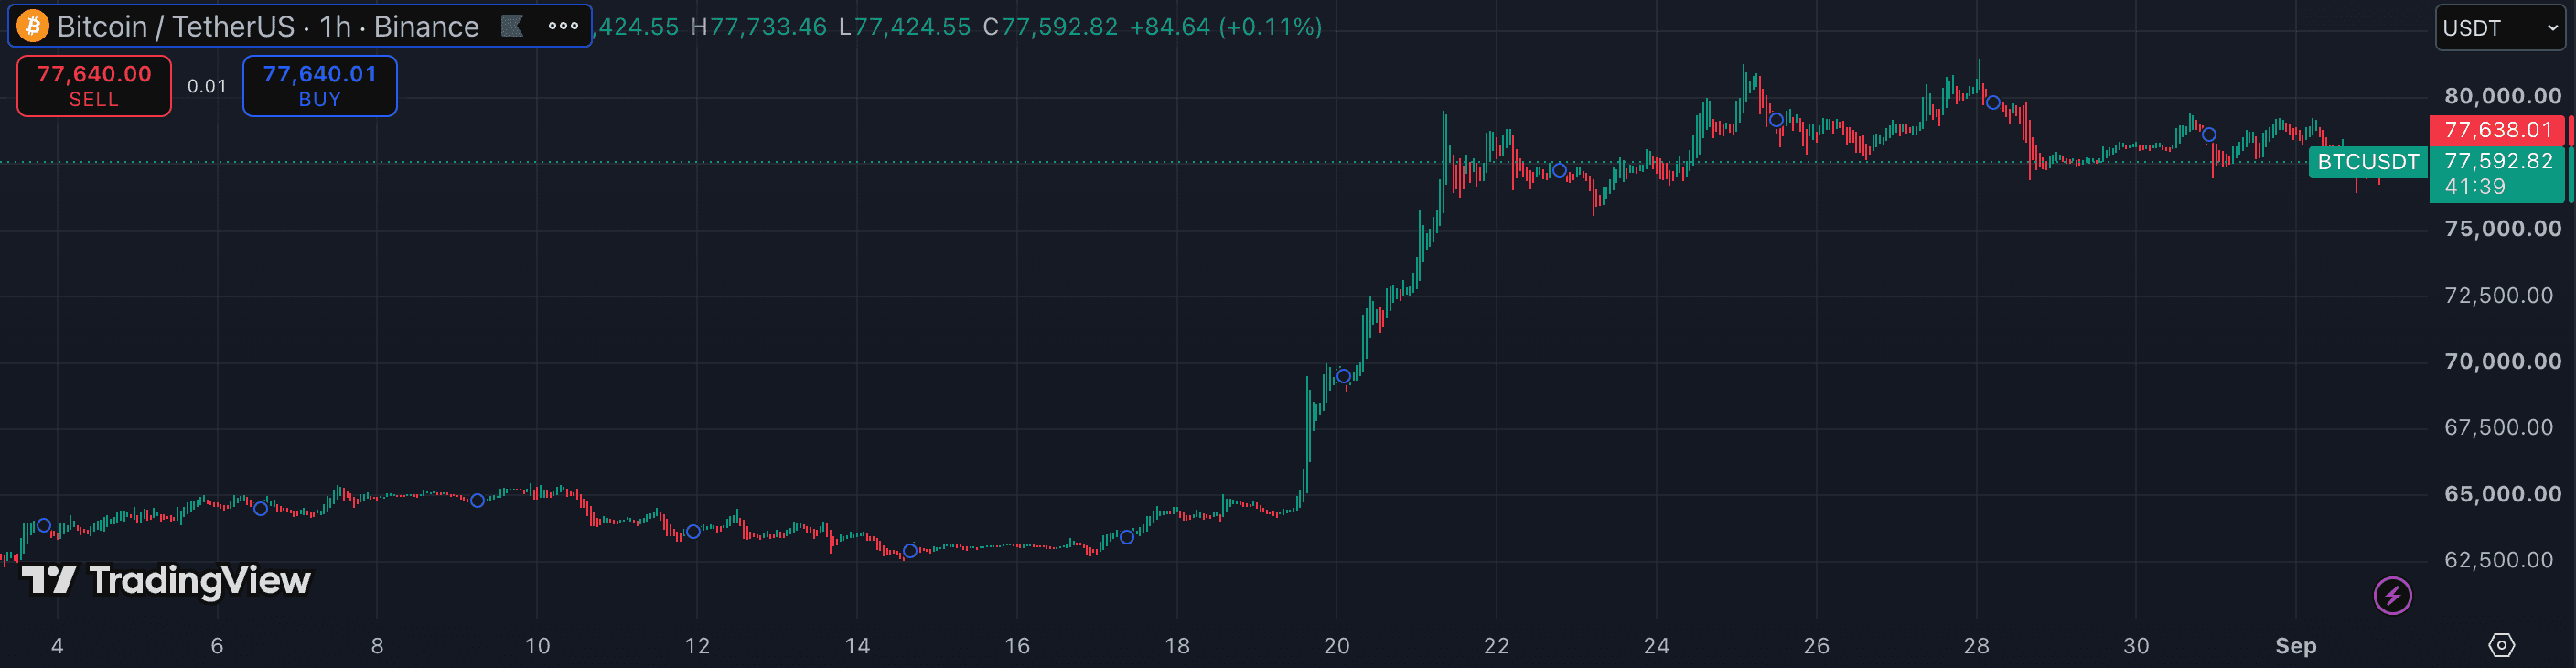
The attributes that matter.
| Attribute | Supertrend | Heikin Ashi |
|---|---|---|
| Tool type | ATR-based directional overlay | Alternative candle chart type |
| Core calculation | Median-price bands offset by an ATR multiple | Averaged current and prior OHLC values |
| Output | One line that flips above or below price | Synthetic candles with colour and wick patterns |
| Volatility response | ATR changes the line's distance from price | Averaging smooths noise but does not measure volatility |
| Trailing reference | Yes — the active line provides a visible reference | No — trend context comes from the candle sequence |
| Typical timeframe | 15m · 1h · 4h | 1h · 4h · 1D |
| Price precision | Regular traded-price candles remain visible | Displayed OHLC values are synthetic |
| Range behaviour | Can flip repeatedly as price crosses the bands | Can alternate colours and conceal some underlying chop |
Which should you choose?
Supertrend is the more structured overlay. Its ATR input adjusts the band distance as recent volatility changes, and the active line provides both a directional state and a visible trailing reference on the regular price chart. The line can still flip repeatedly in a sideways market, so its state does not establish that a durable trend exists by itself.
Heikin Ashi removes more visual clutter. Consecutive same-colour candles make persistence easy to scan, and changes in shadows can show when that smoothed move is becoming less uniform. It does not provide a volatility measurement or a mechanical trailing level, and its synthetic prices mean that regular candles remain necessary whenever precise market levels matter.
If only one trend tool is being added to a regular chart, Supertrend is usually the better first choice because it retains real-price context while adding a volatility-adjusted directional and trailing reference. Choose Heikin Ashi when the goal is specifically to reduce candle-by-candle noise for a calmer higher-timeframe view. Using both is possible, but stacking a smoothed candle series with another simplified trend state can hide detail rather than add independent confirmation.
- You want direction and a volatility-adjusted trailing reference in one overlay
- You need regular candles to remain visible for price and structure analysis
- You work mainly on 15m–4h charts and can filter repeated range flips
- You want the cleanest possible view of trend persistence on 1h–1D charts
- You prefer interpreting candle colour and wick structure over a trailing line
- You maintain a separate regular-candle view for exact levels
Other comparisons
Not investment advice. PineRadar is an editorial directory — links may be affiliate. Always test indicators on a demo account.