SupertrendvsADX
Supertrend and ADX are commonly paired because one maps direction while the other measures trend strength. Supertrend turns ATR into a line that trails price and flips sides; ADX stays in a separate pane and reports the strength of directional movement without identifying bullish or bearish direction on its own. This comparison explains which tool can anchor a chart and which works better as a filter. Educational content only; not financial advice.
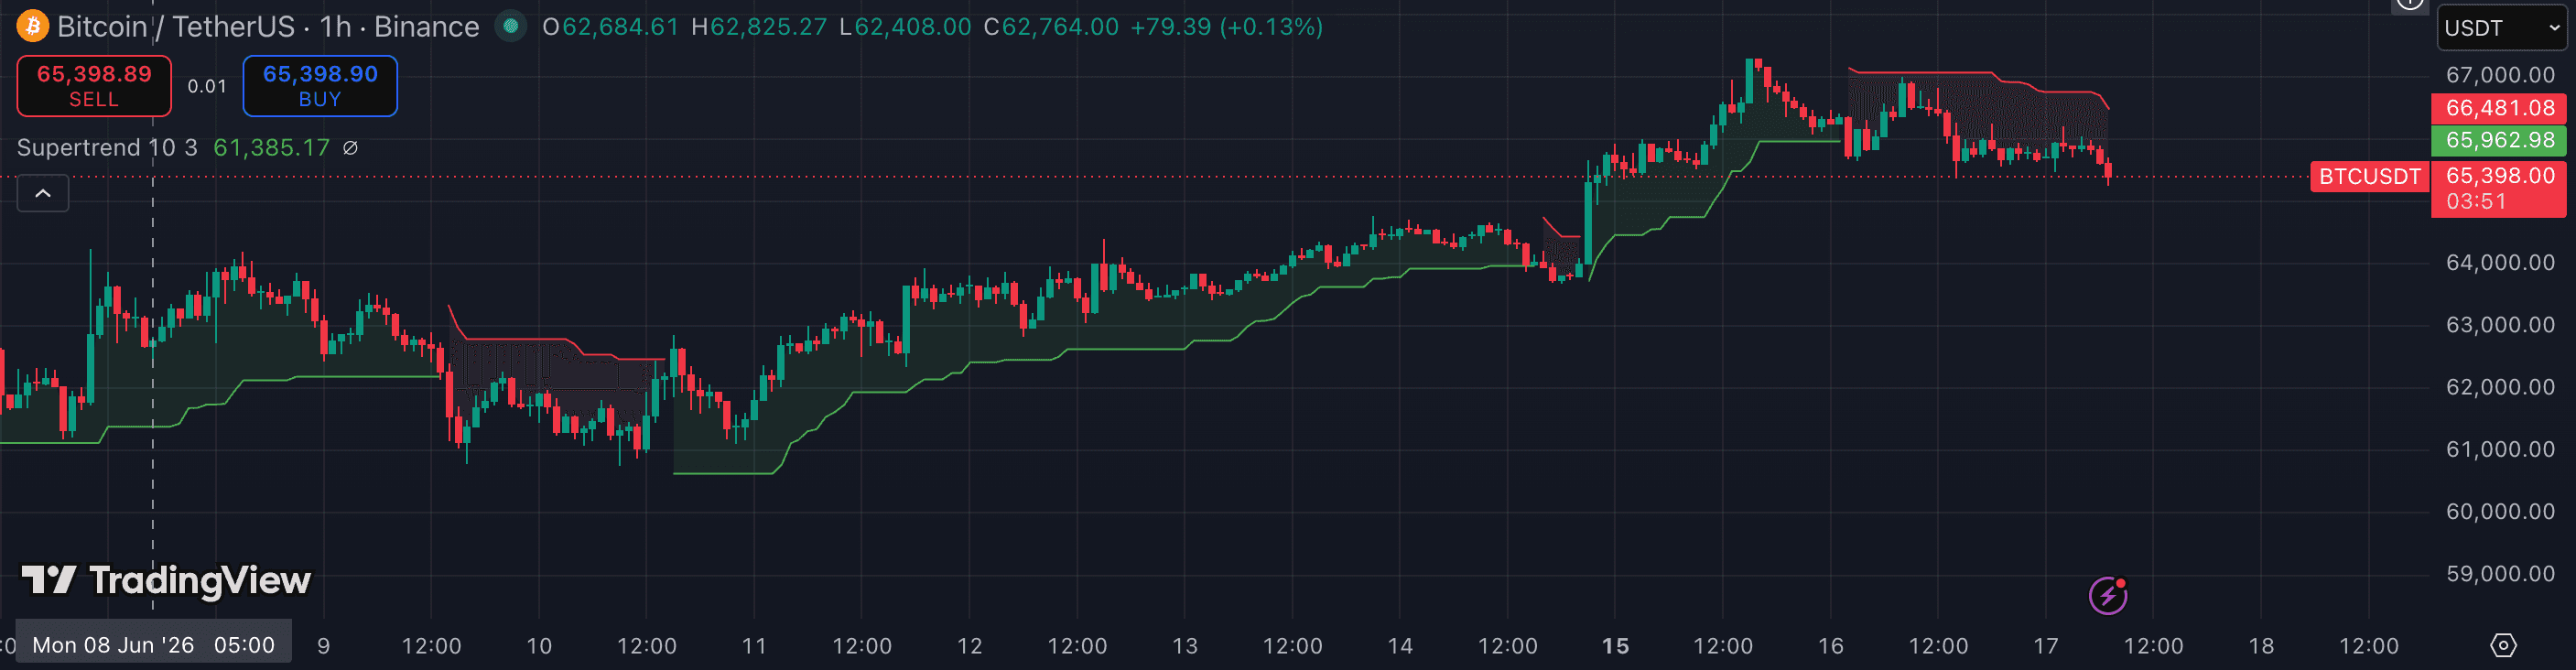
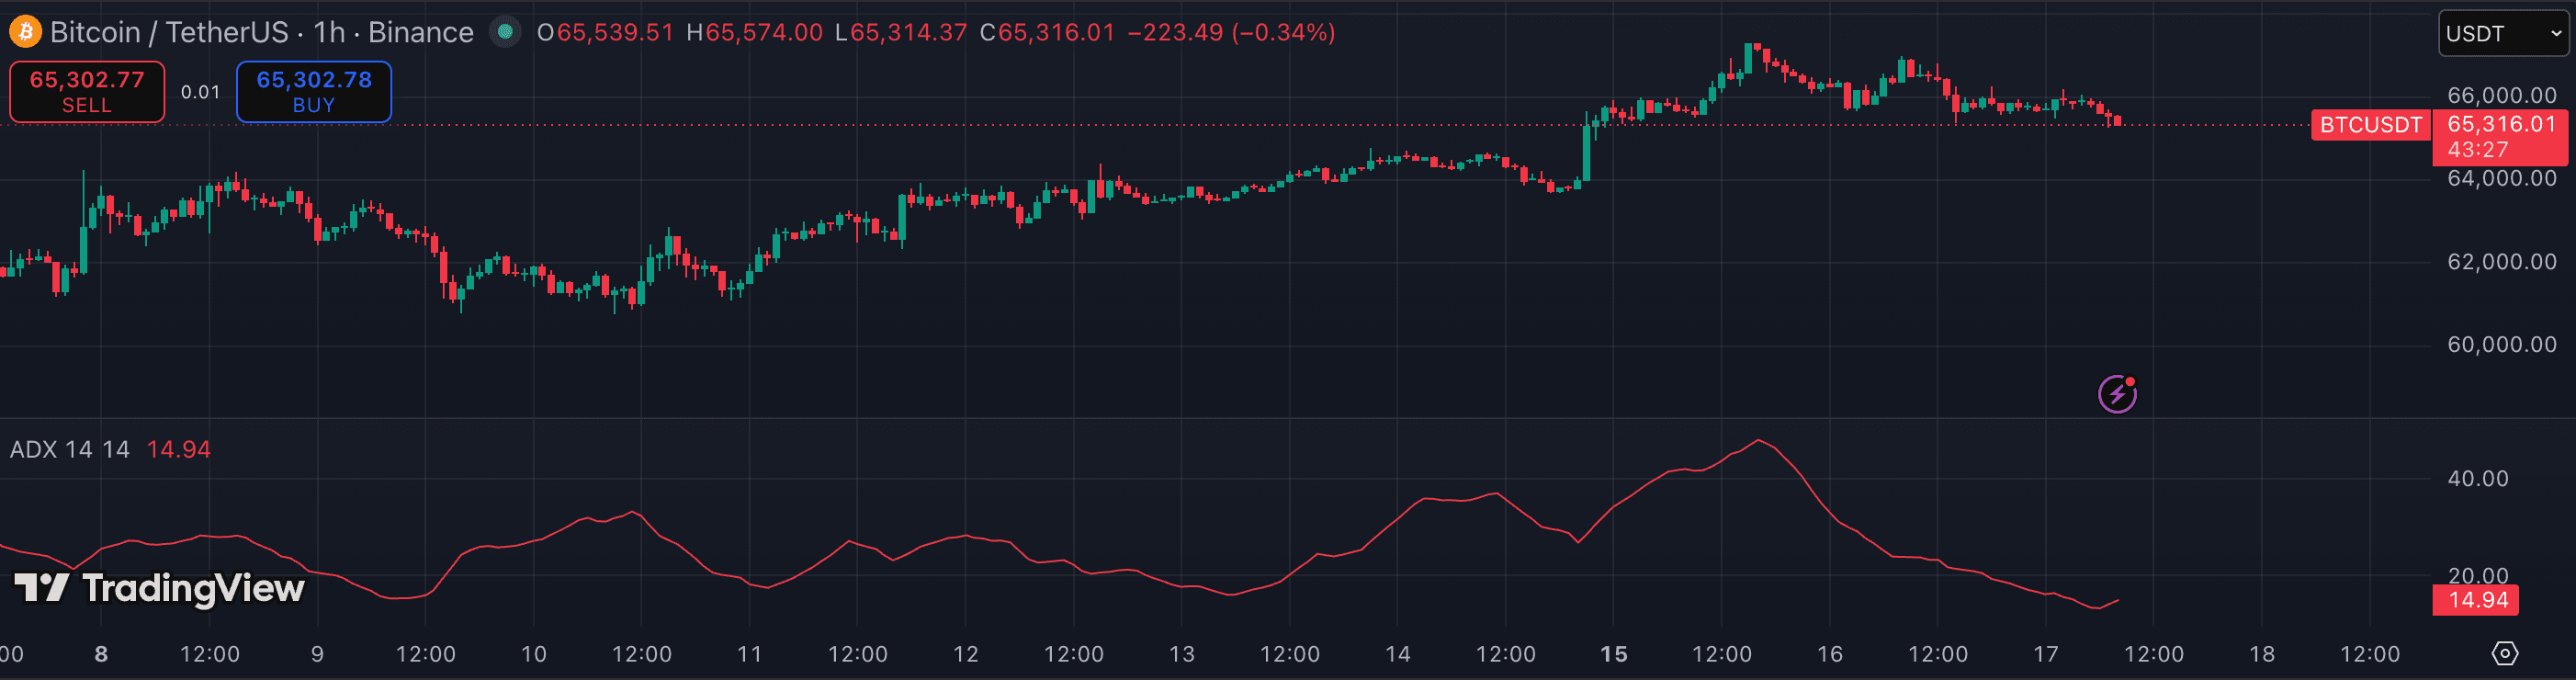
The attributes that matter.
| Attribute | Supertrend | ADX |
|---|---|---|
| Tool type | ATR-based directional overlay | Direction-neutral trend-strength oscillator |
| Core calculation | Median-price bands offset by an ATR multiple | Smoothed relationship between +DM, −DM, and true range |
| Output | One trailing line that flips above or below price | ADX line, usually shown with +DI and −DI |
| Shows direction? | Yes — line side and state provide a directional frame | ADX alone: no; DI lines add directional context |
| Typical timeframe | 15m · 1h · 4h | 1h · 4h · 1D |
| Volatility input | Directly uses ATR to set band distance | Uses true range inside the directional-movement calculation |
| Range behaviour | Can flip repeatedly when price crosses the bands | Low readings help identify weak directional conditions |
| Primary job | Direction and trailing trend reference | Market-regime filter for another directional method |
Which should you choose?
Supertrend is the more complete visual overlay. The ATR multiplier adapts its distance to recent volatility, and the line's position gives a straightforward directional frame that can also act as a trailing reference. Its simplicity comes with a familiar limitation: when price moves sideways across the bands, the state can flip several times without a sustained trend.
ADX is designed to describe that missing regime information. A low or falling reading can reduce confidence that a directional system is operating in a strong trend, while a rising reading shows that directional strength is increasing. ADX does not say which direction should be favoured, and fixed thresholds such as 20 or 25 are conventions rather than universal boundaries, so the reading should be compared with the asset, timeframe, and DI or price context.
If only one tool will occupy the chart, Supertrend is usually the better first choice because it provides both a directional state and a visible price reference. ADX is the better choice when another tool already supplies direction and the remaining task is to classify trend strength. Used together, Supertrend can define the directional state while ADX helps flag weak regimes in which repeated flips deserve less weight; the pair still requires independent price context and consistent settings.
- You want one overlay that shows direction and adapts its distance with ATR
- You need a visible trailing reference on 15m–4h charts
- You prefer a simple chart state over interpreting a separate oscillator pane
- You already have direction and need to measure the strength of the regime
- You want a filter for repeated trend-system signals in sideways conditions
- You are comfortable reading ADX slope separately from +DI and −DI direction
Other comparisons
Not investment advice. PineRadar is an editorial directory — links may be affiliate. Always test indicators on a demo account.