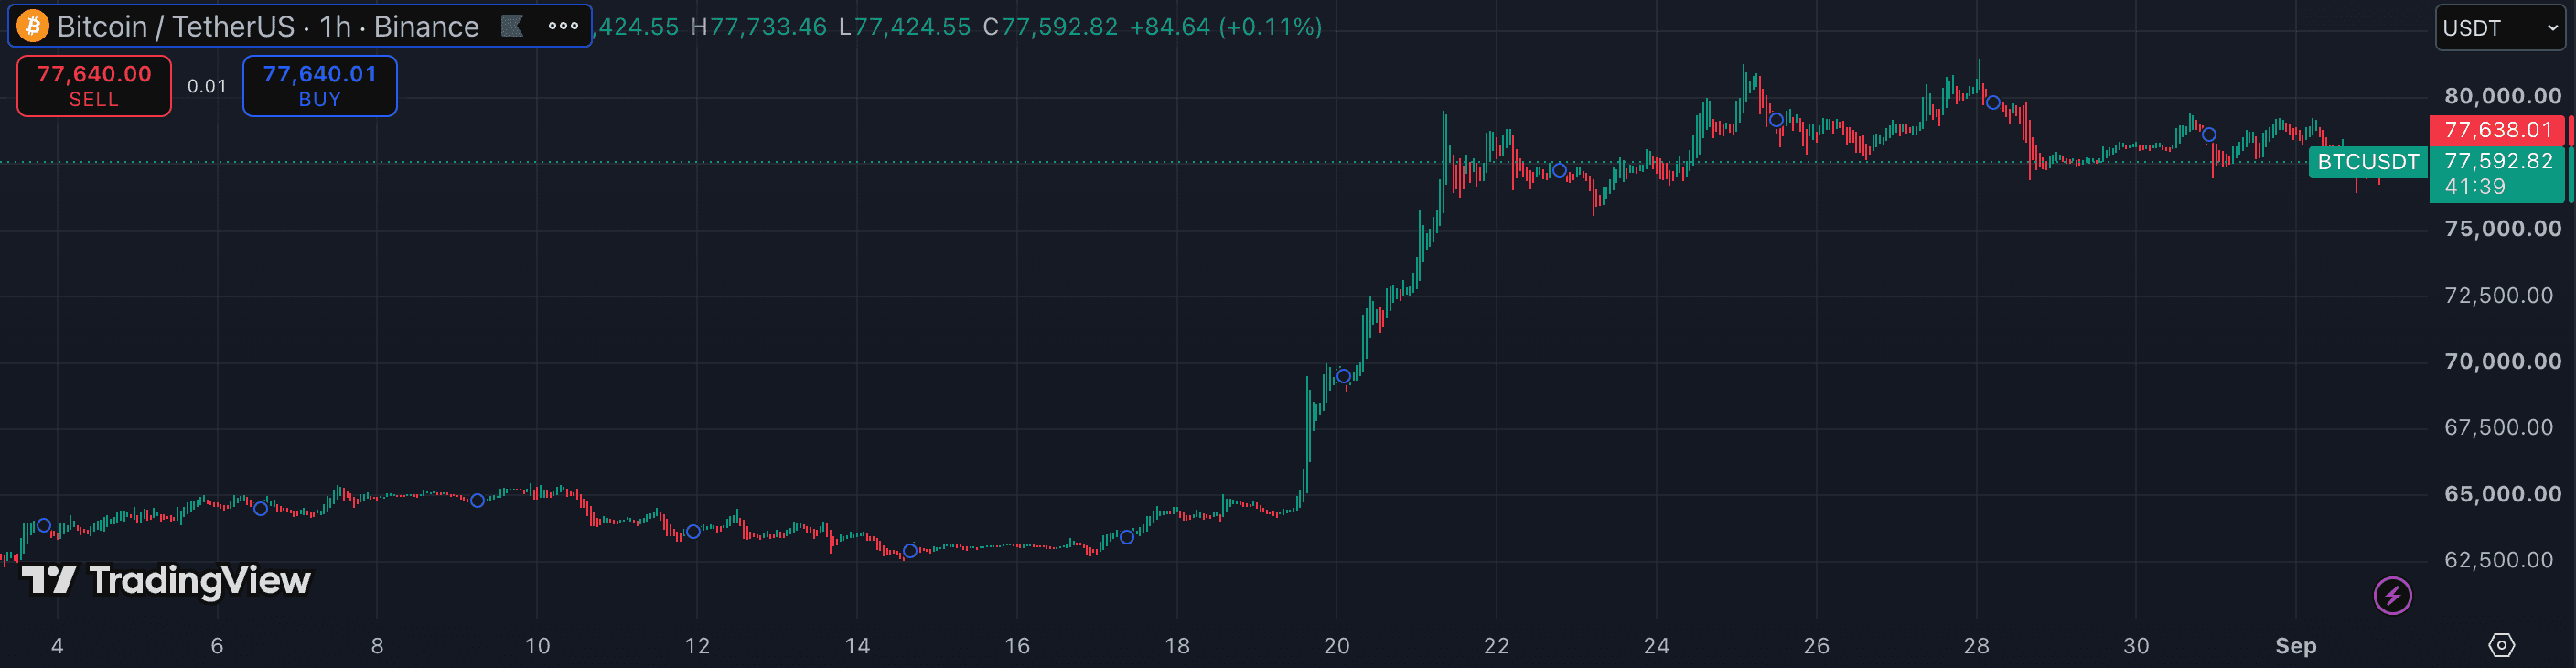
Heikin Ashi recalculates each bar using averages of the prior and current candle's open, high, low, and close. The result is a smoother series that turns multi-bar trends into clean colour runs and makes it far easier to stay in a position during volatile swing moves. The tradeoff is that HA prices are synthetic — they do not match the actual traded prices — so they require a specific workflow to use safely. This guide covers how to read Heikin Ashi signals, what the candle shapes actually mean, and how to pair it with other tools to avoid the common misuse of treating HA like a regular candlestick chart.
1. Understand what Heikin Ashi actually calculates
Each HA candle uses a fixed formula: HA close = (open + high + low + close) ÷ 4; HA open = (prior HA open + prior HA close) ÷ 2; HA high = maximum of real high, HA open, HA close; HA low = minimum of real low, HA open, HA close. Because both the open and close feed from prior bars, consecutive bullish bars build on each other — which is why HA turns bullish runs into uninterrupted green sequences.
The practical consequence: HA prices lag the real market. A momentum reversal will appear one or two bars later on HA than on a standard candle chart. This lag is the price of the smoother visual. Accept it rather than fighting it — the smoothing is the whole point.
2. Read the three key candle shapes
Strong trend bar: a full-bodied bar with no lower shadow (for bullish) or no upper shadow (for bearish). This is the purest signal that momentum is intact — price is closing near the range extreme with no meaningful pullback inside the bar. In a sustained uptrend, a run of no-lower-shadow green bars signals that buyers are in control without hesitation.
Doji or small body: a bar where the HA open and close are close together, producing a small body with shadows on both sides. On a HA chart, this is the transition candle — the trend is pausing and either consolidating or about to reverse. It is not a reversal confirmation by itself; wait for a subsequent bar that confirms direction before acting.
First opposing bar: the first full-bodied bar in the opposite colour after a trend run. Paired with a prior doji, this sequence (doji → opposing colour) is the core HA reversal signal. A single opposing bar mid-trend without a doji first is often noise.
3. Never use HA prices for order entry or stops
HA open and close are averaged values that do not correspond to actual market prices. If a HA candle shows a 'close' at 43,200, the real price at that same moment could be 43,800 or 42,600. Placing entries or stops based on HA levels means you are placing them at prices that did not exist in the order book.
The correct workflow: use HA for the trend read and signal, then switch to the standard candlestick chart (or use the real price overlay) to execute the actual order. Your stop goes below the last real price swing low, not below the HA candle's low.
4. Use HA as a position-holding filter
The strongest use case for Heikin Ashi in crypto is not getting in — it is staying in. In a well-established trend, every normal candle chart will produce pullback candles that look like warnings: a red candle in a bull move, a wick to a key level. On the HA chart, those same bars often show as green dojis with lower wicks — momentum is pausing, not reversing.
Set your rule: only exit or tighten a stop when the HA chart prints a full-bodied opposing candle or two consecutive dojis at the top of a run. Minor HA dojis during a trend are not exits — they are noise filtration working as intended.
5. Pair with a volume or momentum confirmation
Heikin Ashi tells you trend direction but not strength. A run of green HA bars on falling volume is not the same signal as the same run on expanding volume. Add OBV or a simple volume histogram to see whether actual participation is behind the HA signal.
A momentum oscillator like RSI or WaveTrend adds context at reversals: a HA doji appearing when RSI is printing bearish divergence is a much higher-conviction exit setup than a doji alone. Use HA for the visual structure and the secondary indicator for the force measurement.
- Placing stops at HA candle lows or highs — HA prices are synthetic averages that do not correspond to actual traded prices. Always reference the real price chart for order and stop placement.
- Treating every HA doji as a reversal — in strong trends, dojis appear routinely as brief pauses. Wait for a full opposing body candle after the doji before calling a reversal.
- Using Heikin Ashi for scalping on 1m–5m — HA's averaging introduces too much lag at very low timeframes; the signal arrives after the move on fast charts.
- Running HA without a volume read — HA shows trend direction but not conviction. Confirming with OBV or raw volume prevents holding through genuine weakening trends that look fine on HA.
- Mixing HA and standard candles on the same chart for the same analysis — the two price series measure different things. Keep them on separate chart panes to avoid confusing which level belongs to which series.