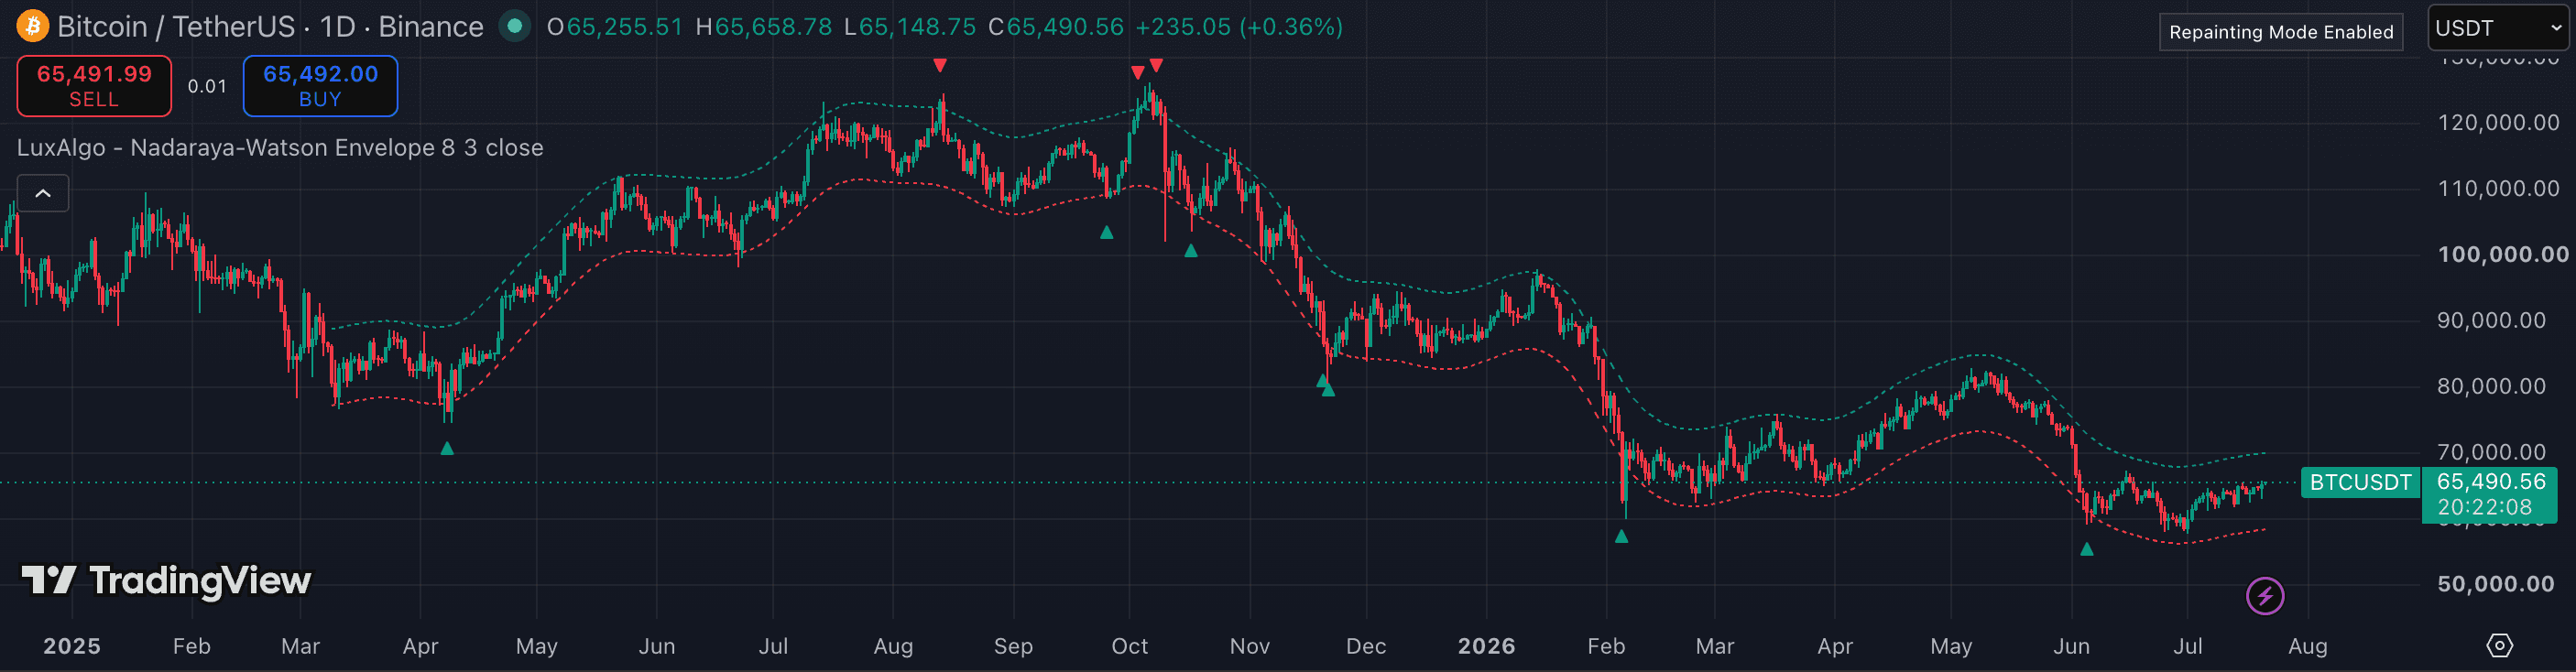
The Nadaraya-Watson Envelope has a reputation for being hard to tune: too low a bandwidth and every bar looks like a signal; too high and the envelope barely moves. The free LuxAlgo implementation on TradingView has two meaningful settings — bandwidth (h) and the ATR multiplier for band width. Getting those two right determines whether you get a useful mean-reversion tool or a chart covered in lines. This guide covers the practical calibration process for different crypto timeframes. Educational content only; not investment advice.
1. Understand what bandwidth (h) controls
The bandwidth parameter controls how much weight the kernel regression gives to nearby bars versus distant bars. A low bandwidth (e.g. h=3–5) makes the curve follow price closely — the envelope hugs price and its crossings happen constantly. A high bandwidth (e.g. h=15–25) smooths the curve heavily — the envelope is slow-moving and only flags major overextensions.
Think of bandwidth like a moving average period: lower bandwidth = more reactive, noisier; higher bandwidth = smoother, fewer signals. The goal is a bandwidth where the envelope curve reflects the general trend shape without mimicking every candle swing.
2. The repaint property — act on closed bars only
The Nadaraya-Watson estimator repaints on the current unclosed bar because the kernel fits the entire visible data window at once, including the live bar. When a new bar closes and becomes historical data, that bar's envelope value is fixed permanently.
This is a mathematical property of the estimator, not a flaw in the script. The correct response is simple: only react to crossings that happened on a completed (closed) bar. Never act on a crossing that is still forming on the current live bar — it will likely repaint before close.
3. Set bandwidth by timeframe
On 1h charts, a bandwidth of 7–9 tends to give a curve that tracks the medium-term trend without over-fitting to individual candles. On 4h charts, h=8–12 is a useful starting range — the slower timeframe can tolerate a slightly more reactive curve without becoming too noisy.
On 1D charts, h=12–20 is appropriate. The daily chart has far fewer bars in the visible window, so the kernel sees less data and needs a higher bandwidth to smooth correctly. Test your chosen bandwidth by asking: does the envelope curve roughly follow the swing structure you would draw manually? If yes, the bandwidth is in the right zone.
4. Tune the ATR multiplier for band width
The ATR multiplier controls how wide the upper and lower bands sit relative to the kernel line. A higher multiplier (e.g. 3.0) means price needs to stretch further to touch the band, producing fewer but more confirmed overextension signals. A lower multiplier (e.g. 1.5–2.0) puts the bands closer to price — more frequent touches but more false signals in trending markets.
For crypto on 1h–4h, an ATR multiplier of 2.0–3.0 is a practical range. Start at 2.0 and raise it if you find the bands are triggering on ordinary pullbacks rather than genuine overextensions.
5. Add a momentum filter before acting on band touches
The Nadaraya-Watson Envelope alone will generate reversal signals in strong one-directional trends — and those signals are wrong. Before acting on a band touch or crossing, check a momentum read: is RSI showing divergence? Is MACD histogram shrinking? Is there a clear structure rejection candle?
A band touch with no momentum confirmation is not a trade setup. A band touch with RSI divergence, a structure level nearby, and a clear candle rejection is a meaningful confluence.
- Acting on live-bar crossings — the envelope repaints on the current bar by design. Only trade completed bar signals.
- Using the same bandwidth across all timeframes — h=8 that works on 1h will over-fit on daily charts. Calibrate per timeframe.
- Fading strong trends because price touched the outer band — in a trending market the envelope can walk along the band for extended periods. A band touch is not an automatic reversal.
- Setting the ATR multiplier too low (below 1.5) — bands this close to price trigger constantly and produce mostly noise.
- Not accounting for the look-back window — if you zoom out and see many more bars, the kernel recalculates and past crossings may appear in different locations. Stick to a consistent zoom level when analysing signals.